enVision Math Common Core Answer Key for Grade 8, 7, 6, 5, 4, 3, 2, 1, and Kindergarten
- enVision Math Common Core Kindergarten Answer Key
- enVision Math Common Core Grade 1 Answer Key
- enVision Math Common Core Grade 2 Answer Key
- enVision Math Common Core Grade 3 Answer Key
- enVision Math Common Core Grade 4 Answer Key
- enVision Math Common Core Grade 5 Answer Key
- enVision Math Common Core Grade 6 Answer Key
- enVision Math Common Core Grade 7 Answer Key
- enVision Math Common Core Grade 8 Answer Key
enVision Math Common Core Grade 8 Answer Key
- Topic 1 Real Numbers
- Topic 2 Analyze and Solve Linear Equations
- Topic 3 Use Functions to Model Relationships
- Topic 4 Investigate Bivariate Data
- Topic 5 Analyze and Solve Systems of Linear Equations
- Topic 6 Congruence and Similarity
- Topic 7 Understand and Apply the Pythagorean Theorem
- Topic 8 Solve Problems Involving Surface Area and Volume
enVision Math Common Core Grade 7 Answer Key
- Topic 1 Rational Number Operations
- Topic 2 Analyze and Use Proportional Relationships
- Topic 3 Analyze and Solve Percent Problems
- Topic 4 Generate Equivalent Expressions
- Topic 5 Solve Problems Using Equations and Inequalities
- Topic 6 Use Sampling to Draw Inferences About Populations
- Topic 7 Probability
- Topic 8 Solve Problems Involving Geometry
enVision Math Common Core Grade 6 Answer Key
- Topic 1 Use Positive Rational Numbers
- Topic 2 Integers and Rational Numbers
- Topic 3 Numeric and Algebraic Expressions
- Topic 4 Represent and Solve Equations and Inequalities
- Topic 5 Understand and Use Ratio and Rate
- Topic 6 Understand and Use Percent
- Topic 7 Solve Area, Surface Area, and Volume Problems
- Topic 8 Display, Describe and Summarize Data
enVision Math Common Core Grade 5 Answer Key
- Topic 1 Understand Place Value
- Topic 2 Use Models and Strategies to Add and Subtract Decimals
- Topic 3 Fluently Multiply Multi-Digit Whole Numbers
- Topic 4 Use Models and Strategies to Multiply Decimals
- Topic 5 Use Models and Strategies to Divide Whole Numbers
- Topic 6 Use Models and Strategies to Divide Decimals
- Topic 7 Use Equivalent Fractions to Add and Subtract Fractions
- Topic 8 Apply Understanding of Multiplication to Multiply Fractions
- Topic 9 Apply Understanding of Division to Divide Fractions
- Topic 10 Represent and Interpret Data
- Topic 11 Understand Volume Concepts
- Topic 12 Convert Measurements
- Topic 13 Write and Interpret Numerical Expressions
- Topic 14 Graph Points on the Coordinate Plane
- Topic 15 Algebra: Analyze Patterns and Relationships
- Topic 16 Geometric Measurement: Classify Two-Dimensional Figures
enVision Math Common Core Grade 4 Answer Key
- Topic 1 Generalize Place Value Understanding
- Topic 2 Fluently Add and Subtract Multi-Digit Whole Numbers
- Topic 3 Use Strategies and Properties to Multiply by 1-Digit Numbers
- Topic 4 Use Strategies and Properties to Multiply by 2-Digit Numbers
- Topic 5 Use Strategies and Properties to Divide by 1-Digit Numbers
- Topic 6 Use Operations with Whole Numbers to Solve Problems
- Topic 7 Factors and Multiples
- Topic 8 Extend Understanding of Fraction Equivalence and Ordering
- Topic 9 Understand Addition and Subtraction of Fractions
- Topic 10 Extend Multiplication Concepts to Fractions
- Topic 11 Represent and Interpret Data on Line Plots
- Topic 12 Understand and Compare Decimals
- Topic 13 Measurement: Find Equivalence in Units of Measure
- Topic 14 Algebra: Generate and Analyze Patterns
- Topic 15 Geometric Measurement: Understand Concepts of Angles and Angle Measurement
- Topic 16 Lines, Angles, and Shapes
enVision Math Common Core Grade 3 Answer Key
- Topic 1 Understand Multiplication and Division of Whole Numbers
- Topic 2 Multiplication Facts: Use Patterns
- Topic 3 Apply Properties: Multiplication Facts for 3, 4, 6, 7, 8
- Topic 4 Use Multiplication to Divide: Division Facts
- Topic 5 Fluently Multiply and Divide within 100
- Topic 6 Connect Area to Multiplication and Addition
- Topic 7 Represent and Interpret Data
- Topic 8 Use Strategies and Properties to Add and Subtract
- Topic 9 Fluently Add and Subtract within 1,000
- Topic 10 Multiply by Multiples of 10
- Topic 11 Use Operations with Whole Numbers to Solve Problems
- Topic 12 Understand Fractions as Numbers
- Topic 13 Fraction Equivalence and Comparison
- Topic 14 Solve Time, Capacity, and Mass Problems
- Topic 15 Attributes of Two-Dimensional Shapes
- Topic 16 Solve Perimeter Problems
enVision Math Common Core Grade 2 Answer Key
- Topic 1 Fluently Add and Subtract Within 20
- Topic 2 Work with Equal Groups
- Topic 3 Add Within 100 Using Strategies
- Topic 4 Fluently Add Within 100
- Topic 5 Subtract Within 100 Using Strategies
- Topic 6 Fluently Subtract Within 100
- Topic 7 More Solving Problems Involving Addition and Subtraction
- Topic 8 Work with Time and Money
- Topic 9 Numbers to 1,000
- Topic 10 Add Within 1,000 Using Models and Strategies
- Topic 11 Subtract Within 1,000 Using Models and Strategies
- Topic 12 Measuring Length
- Topic 13 Shapes and Their Attributes
- Topic 14 More Addition, Subtraction, and Length
- Topic 15 Graphs and Data
enVision Math Common Core Grade 1 Answer Key
- Topic 1 Understand Addition and Subtraction
- Topic 2 Fluently Add and Subtract Within 10
- Topic 3 Addition Facts to 20: Use Strategies
- Topic 4 Subtraction Facts to 20: Use Strategies
- Topic 5 Work with Addition and Subtraction Equations
- Topic 6 Represent and Interpret Data
- Topic 7 Extend the Counting Sequence
- Topic 8 Understand Place Value
- Topic 9 Compare Two-Digit Numbers
- Topic 10 Use Models and Strategies to Add Tens and Ones
- Topic 11 Use Models and Strategies to Subtract Tens
- Topic 12 Measure Lengths
- Topic 13 Time and Money
- Topic 14 Reason with Shapes and Their Attributes
- Topic 15 Equal Shares of Circles and Rectangles
enVision Math Common Core Grade K Answer Key
- Topic 1 Numbers 0 to 5
- Topic 2 Compare Numbers 0 to 5
- Topic 3 Numbers 6 to 10
- Topic 4 Compare Numbers 0 to 10
- Topic 5 Classify and Count Data
- Topic 6 Understand Addition
- Topic 7 Understand Subtraction
- Topic 8 More Addition and Subtraction
- Topic 9 Count Numbers to 20
- Topic 10 Compose and Decompose Numbers 11 to 19
- Topic 11 Count Numbers to 100
- Topic 12 Identify and Describe Shapes
- Topic 13 Analyze, Compare, and Create Shapes
- Topic 14 Describe and Compare Measurable Attributes
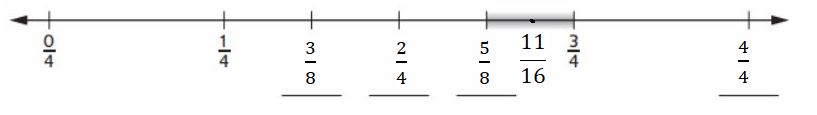


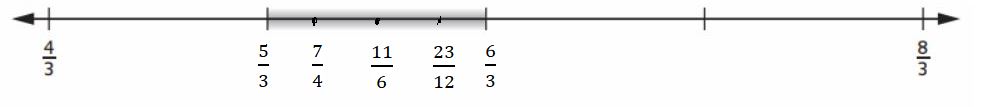
 = \(\frac{3}{4}\)