Mean of Ungrouped Data: Ungrouped data is the type of distribution where individual data is presented in a raw form. The mean of data shows how the data are scattered throughout the central part of the distribution. Hence, the arithmetic numbers are called the measures of central tendencies.
Here, the mean is also known as the arithmetic mean or average of all the observations in the data. In this article, we will be explaining what is the mean of ungrouped data, the formula to find the mean for ungrouped data, steps to calculate mean deviation for raw data, some practice Examples on Mean of Arrayed Data.
Do Check Related Articles:
Mean of Raw Data or Arrayed Data or Ungrouped Data
In Statistics, Mean is nothing but the measurement of average and it defines the central tendency of a given set of data.
In short, the mean of the given data set is estimated by adding all the observations and then dividing by the total number of observations.
The mean of ungrouped data is denoted by the mathematical symbol or notation ie, \(\overline{x}\)
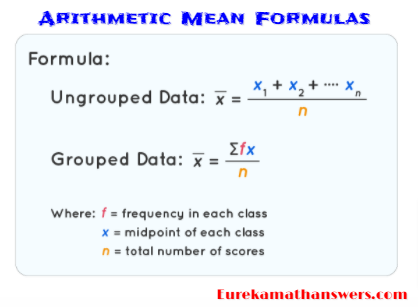
The mean of the ungrouped data or arrayed data when it is raw can be measured by utilizing the following formula:
The mean of n observations (variables) x1, x2, x3, x4, ….., xn is given by the formula:
Mean = (x1+ x2 + x3 + x4 +…..+ xn ) / n = ∑xi / n
where ∑xi = x1+ x2 + x3 + x4 +…..+ xn
For instance, let’s take the scores of 10 students are 5, 10, 15, 20, 25, 30, 35, 40, 45, 50.
Hence, the mean scores of 10 students = ∑xi / n
= 5+10+15+20+25+30+35+40+45+50 / 10 = 27.5(approx).
Formula for Ungrouped Mean Data
How to Find Assumed Mean of Ungrouped Data?
Want to know more about the assumed mean of ungrouped data? Please have a look at the below stuff and understand the concept of it clearly.
In the method of assumed mean, the values that are taken from the data or not can be used as assumed mean. Yet, it must be centrally positioned in the data so that to determine the mean of the given data via easy calculations.
The formula for the Assumed mean of ungrouped data is A+ sd/N
Where, A is the assumed mean,
sd is the summation of X-A for all figures, and
N is the frequency or the number of elements in the given data.
Apply the formula directly and calculate the assumed mean of the given data with ease and confidence.
Steps to Determine the Mean Deviation for Ungrouped data
The following steps are mainly helpful for all students to calculate the mean for ungrouped data. Simply have a look at them and solve the arithmetic mean of raw data easily.
Let x1, x2, x3, x4, ….., xn observations consist in the given set of data.
Step 1: In the first step, we have to find out the mean deviation of the measure of central tendency. Assume that the measure is a.
Step 2: Find the absolute deviation of each variable from the measure of central tendency which is obtained in step 1 ie.,
|x1 – a|, |x2 – a|, |x3 – a|, …., |xn – a|
Step 3: Estimate the mean of all absolute deviations. At last, it provides the mean absolute deviation (M.A.D) about a for ungrouped data ie.,
![]()
If the central tendency measure is mean then the resulted equation can be rewritten as:
![]() Where, \(\overline{x}\) is the mean.
Where, \(\overline{x}\) is the mean.
Let’s understand these calculating steps very clearly by practicing with the solved mean of ungrouped data questions with answers.
Mean of Ungrouped Data Example Problems
Example 1:
In the competition of banana eating, the number of bananas consumed by 7 contestants in an hour is as follows: 10, 13, 16, 19, 22, 25, 30. Find the mean deviation from the mean of the given raw data.
Solution:
Given the number of bananas eaten by 7 contestants are 10, 13, 16, 19, 22, 25, 30
Let’s apply the above steps for finding the M.A.D about the mean.
Step 1: The mean of the following data can be given by,
\(\overline{x}\) = \(\frac { 10+13+16+19+22+25+30 }{ 7 } \)
= \(\frac { 135 }{ 7 } \) = 19.2(appox)
Step 2: Now find the absolute deviation around each observation,
|x1 – \(\overline{x}\)| = |10-19| = 9
|x2 – \(\overline{x}\)| = |13-19| = 6
|x3 – \(\overline{x}\)| = |16-19| = 3
|x4 – \(\overline{x}\)| = |19-19| = 0
|x5 – \(\overline{x}\)| = |22-19| = 3
|x6 – \(\overline{x}\)| = |25-19| = 6
|x7 – \(\overline{x}\)| = |30-19| = 11
Step 3: Finally, calculate the mean deviation for ungrouped data by using the following formula:
M.A.D(x) = ∑ni=1|xi−a| / n
= \(\frac { 9+6+3+0+3+6+11 }{ 7 } \)
= \(\frac { 38 }{ 7 } \) = 5.428
Example 2:
The mean length of ropes in 20 coils is 12 m. A new coil is added in which the length of the rope is 16 m. What is the mean length of the ropes now?
Solution:
Given that, the mean length of ropes in 20 coils is 12 m. Let’s find the sum of length for each rope using mean formula:
Mean(length) A = x1+ x2 + x3 + x4 +…..+ x20 / 20
⟹ 12 = x1+ x2 + x3 + x4 +…..+ x20 / 20
⟹ x1+ x2 + x3 + x4 +…..+ xn = 240 …….(i)
Now, add one coil and find the mean of new coils of rope,
A = x1+ x2 + x3 + x4 +…..+ x20 + x21 / 21
Here, length of new rope is 16m and use equation (i)
= x1+ x2 + x3 + x4 +…..+ x20 + x21 / 21
= \(\frac { 240 + 16}{ 21 } \)
= \(\frac { 256 }{ 21 } \)
= 12.19 (Appox)
Hence, the required new mean length is 12.19 m approximately.
Example 3:
The ages in years of 6 teachers of a school are 32, 28, 54, 40, 65, 20. What is the mean age of these teachers?
Solution:
Mean age of the teachers = \(\frac { Sum of the age of teachers}{ Number of teachers } \)
= \(\frac { (32+28+54+40+65+20) }{ 6 } \)
= \(\frac { 239 }{ 6 } \)
= 39.8 (approx) years.