Statistics is the most important concept in mathematics which is used widely across an array of applications and professions. Statistics is the study and manipulation of data, including ways to gather, review, analyze, and draw conclusions from data.
It is also used for making better-informed business and investing decisions. Explore what is statistics and probability, types of statistics, statistics examples, methods, mathematical statistics, statistical data representation, formulas, etc. from this Statistics PDF and become proficient in solving problems. Go with the below links and directly dig deep into the statistics math concepts.
Sub-Topics of Statistics
- Real-Life Statistics
- Terms Related to Statistics
- Frequency Distribution of Ungrouped and Grouped Data
- Use of Tally Marks
- Class Limits in Exclusive and Inclusive Form
- Construction of Bar Graphs
- Mean
- Mean of the Tabulated Data
- Mode
- Median
- Construction of Pie Chart
- How to Construct a Line Graph?
- Statistics and Statistical Data
- Representation of Data
- Statistical Variable
- Range of the Statistical Data
- Frequency of the Statistical Data
- Mean of Ungrouped Data
- Arithmetic Mean
- Word Problems on Arithmetic Mean
- Properties of Arithmetic Mean
- Problems Based on Average
- Problems on Mean of Ungrouped Data
- Properties Questions on Arithmetic Mean
- Median of Raw Data
- Problems on Median of Ungrouped Data
- Worksheet on Mean of Ungrouped Data
- Worksheet on Median of Ungrouped Data
- Frequency Distribution
- Class Interval
- Constructing Frequency Distribution Tables
- Class Limits
- Class Boundaries
- Nonoverlapping Class Intervals into Overlapping Class Intervals
- Cumulative Frequency
What is Statistics in Math?
Basically, statistics is the collection of data and study of analyzing, interpreting, and organizing the collected data in a meaningful manner. We will use statistics in various fields like psychology, business, social sciences, humanities, government, and manufacturing. Statistics is the branch of applied mathematics that uses the principle of probability to simplify the sample collected data.
Mathematical Statistics Definition
The application of mathematics to statistics is called Mathematical statistics. Initially related to the science of the state where it was utilized in the collection and analysis of facts & data regarding a country: its economy, and, military, population, and so forth.
Mathematical analysis, linear algebra, stochastic analysis, differential equation, and measure-theoretic probability theory are some of the mathematical techniques implemented in Mathematical statistics.
Types of Statistics
There are two ways of analyzing data in mathematical statistics that are practiced on a large scale. They are:
- Descriptive Statistics: Data or group of data is represented in summary.
- Inferential Statistics: It is utilized to illustrate the descriptive one.
Also, one more statistics type is there, where descriptive is transitioned into inferential stats.
Methods in Statistics
A few statistics methods are given here in the list.
- Data collection
- Data summarization
- Statistical analysis
The methods include collecting, summarizing, analyzing, and interpreting variable numerical data.
Formulas of Statistics
The list of statistics formulas that are primarily used in solving math problems related to statistics and statistical analysis is provided in the mentioned table.
| Sample Mean(\(\overline{x}\)) | \(\frac {∑x}{ n } \) |
| Population Mean(µ) | \(\frac {∑x}{ N } \) |
| Sample Standard Deviation (s) | \(\sqrt{ [latex]\frac {∑(x-[latex]\overline{x}\))²}{ n-1 } [/latex] }[/latex] |
| Population Standard Deviation (σ) | \(\sqrt{ [latex]\frac {(x-µ)²}{ N } \) }[/latex] |
| Sample Variance (s²) | \(\frac {∑(x<sub>i</sub>-[latex]\overline{x}\))²}{ n-1 } [/latex] |
| Population Variance (σ²) | \(\frac {∑(x<sub>i</sub>-µ²}{ N } \) |
| Range (R) | Largest data value – smallest data value |
Data Representation in Statistics
A group of facts and observations is called data. It can be in the form of measurements, statements, or numbers. After knowing the data collection methods, we can easily aim at representing the gathered data in various forms of graphs like a bar graph, line graphs, pie charts, stem and leaf plots, scatter plots, and so on. Let’s have a glance at the different kinds of representation of data in statistics from the below table.
| Data Representation | Description |
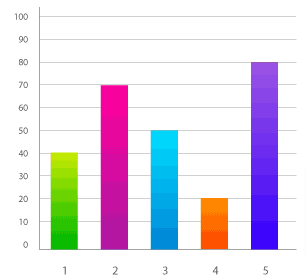 |
Bar Graph: The collection of data described with rectangular bars with lengths proportional to the values is a bar graph and the bars can be plotted either vertically or horizontally. |
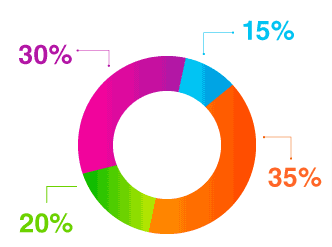 |
Pie Chart: The pie chart is one more commonly used data representation graph that divides the data into sectors in a circle form. Each sector of the circle represents a proportion of the whole. |
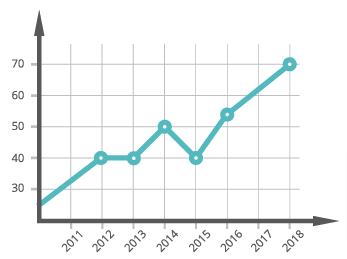 |
Line graph: Data represented in the line graph is in the form of series where it connected with a straight line and these series are known as markers. |
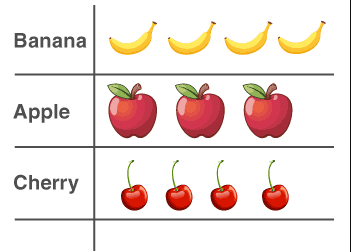 |
Pictograph: A pictorial symbol for a word or phrase, i.e. showing data with the help of pictures. Such as Apple, Banana & Cherry can have different numbers, and it is just a representation of data. |
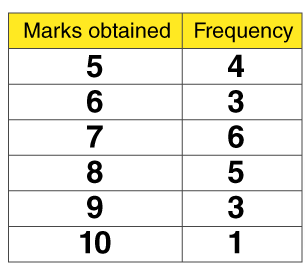 |
Frequency Distribution: The frequency of a data value is often represented by “f.” A frequency table is constructed by arranging collected data values in ascending order of magnitude with their corresponding frequencies. |
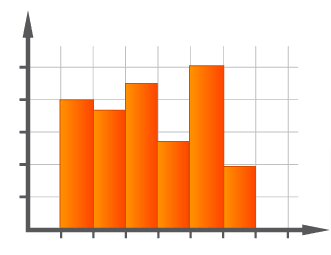 |
Histogram: A diagram is consisting of rectangles. Whose area is proportional to the frequency of a variable and whose width is equal to the class interval. |
Different Models of Statistics
The term of statistics is used in many forms, different models of statics are utilized in different forms. A few models are listed below:
Skewness: The word skewness is referred to a measure of the asymmetry in a probability distribution in statistics. It all measures the deviation of the normal distribution curve for data. Positive or negative or zero can be the values of skewed distribution
Degree of freedom: When the values got changed, then we use this model of statistics. A degree of freedom is defined as the information or independent data moved while estimating a parameter.
ANOVA Statistics: The full form of ANOVA is Analysis of Variance. ANOVA is used to compare the performance of stocks over a period of time. The measure utilized in finding the mean difference for the given dataset is known as ANOVA Statistics.
Regression Analysis: In this Regression Analysis model, the statistical process specifies the relationship between the variables. Also, it indicates how a dependent variable alters when an independent variable is altered.
Measures of Central Tendency in Statistics
The basics of descriptive statistics are the measure of central tendency and the measure of dispersion. Also, the measure of central tendency is the representative value for the given data which provides us a view of where data points are centered. This is made to know how the data are disordered around this centered measure. To find the central measures of tendency, we use mean, median, and mode. However, various measures of central tendency for the data are:
- Arithmetic Mean
- Median
- Mode
- Geometric Mean
- Harmonic Mean
Hoping that the information discussed above on the statistics concept helped you a lot to understand the sub-topics and solve problems quickly and efficiently. Find more Maths concepts at Eurekamathanswer.com and learn well for your board and competitive exams.
FAQs on Branches of Statistics
1. What is Statistics and its branches?
Statistics is a part of applied mathematics that includes the collection, description, analysis, and inference of conclusions from quantitative data. The two important branches of statistics are Descriptive and Inferential statistics.
2. What are the five stages of statistics?
The list of five stages of statistics are as follows:
- Collection of Data
- Organizing the Collected Data
- Presentation of Data
- Analysis of the Data
- Interpretation of Data
3. How to apply statistics in Mathematics?
Statistics is a branch of Applied Mathematics that leads to the use of probability theory for simplifying the sample data we collect. It helps in identifying the probability where the generalizations of data are accurate. We relate to this as statistical inference.