In statistics and statistical data concepts, learning the basic knowledge about statistical variables, statistical range, and statistical data frequency is very important. In this article, we are going to deal with the Frequency of the Statistical Data like what is it, what are the types, how to calculate it, and some solved example problems on the frequency distribution in statistics. Just dive into this page and enhance your problem-solving & conceptual skills.
Check Related Topics:
What is Frequency in Statistics?
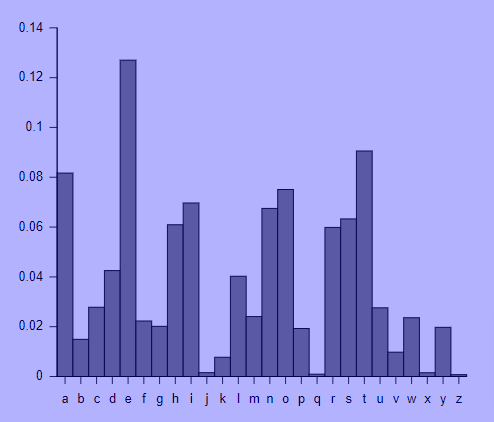
In statistics, the frequency (or absolute frequency) of an event ‘i’ is the number ni of times the observation occurred/recorded in an experiment or study. The frequency of the data is represented graphically in histograms.
An instance of the frequency distribution of alphabet letters in the English language is shown in the histogram below:
Types of Statistical Data Frequency
Under Statistics, you will find four types of frequency distribution and they are as follows:
- Grouped Frequency
- Ungrouped Frequency
- Cumulative Frequency
- Relative Frequency
How to Find the Frequency?
The calculation of frequency can be done easily by following the steps given here. Simply find the frequency by dividing the number of repetitions of an event by the time it is needed for those repetitions to occur. Look at the steps:
- Learn the action
- Choose the length of time beyond which you will measure the frequency.
- Divide the number of times the event occurs by the length of time.
How to Calculate Frequency Statistics in Ungrouped Distribution?
The given steps should be followed by students to learn how to find frequency statistics in the case of an ungrouped frequency distribution.
Step 1: Finding the Range of Data Changes
Step 2: Finding the Frequencies
Here, first, we sort the given data in order from small to large and then calculate the frequency of each data.
Frequency of the Statistical Data Examples with Solutions
Example 1:
What is the frequency of 3 in the following data?
5, 6, 3, 3, 2, 4, 7, 5, 2, 3, 5, 6, 5, 4, 4, 3, 5, 2, 5, 3.
Solution:
Given data is 5, 6, 3, 3, 2, 4, 7, 5, 2, 3, 5, 6, 5, 4, 4, 3, 5, 2, 5, 3.
To find the frequency of 3, look at the given data and find out how many times it appears.
Here, 3 appears 5 times in the collection.
Hence, the frequency of 3 is 5.
Example 2:
The weights (in kg) of the 15 students of a class are recorded as 60, 65, 63, 70, 65, 62, 65, 63, 64, 60, 68, 58, 62, 64, 65. What is the value of the variable whose frequency is 4?
Solution:
Given weights (in kg) of the 15 students of a class is 60, 65, 63, 70, 65, 62, 65, 63, 64, 60, 68, 58, 62, 64, 65
From the data, 65 is the value of the variable whose frequency is 4.
FAQs on Frequency Distribution of the Statistical Data
1. What are the basic steps to find the frequency statistics in Grouped Distribution?
The basic steps for calculating the frequency statistics in Grouped Distribution are as follows:
Step 1: Obtaining the Range of Data Changes
Step 2: Finding the Range Changes within Each Group
Step 3: Creating the Groups
Step 4: Calculating the Frequencies
2. What is the formula for Relative Frequency?
The formula to find the relative frequency is the ratio (fraction or proportion) of the number of times a value of the data occurs in the set of all outcomes to the total number of outcomes. ie.,
Relative frequency = \(\frac { frequency of the class }{ total } \)
3. How do you calculate the Cumulative relative frequency?
To calculate the cumulative relative frequency, we have to do a summation of all previous relative frequencies to the relative frequency for the current row ie.,
Cumulative relative frequency = sum of previous relative frequencies + current class frequency