Range of the Statistical Data: Do you find difficulty when determining the difference between a set of numbers? Calculating the range of their data set is an easy trick. Many of the statisticians, analysts, and mathematicians used this to find the exact variation of a set of numbers.
In this mini range of the statistical data article, we are going to explain the concept of range in statistics. Explore what is the definition of range in statistics, formula, how to find the range of a dataset, what is the rule of thumb to calculate the range and limitations of range.
Do Check:
What is meant by the Range of Data in Statistics?
In statistics, the spread of your data from the lowest to the highest value in the distribution and also commonly used measure of variability is known as Range of Data. The symbol for range in statistics is R.
The calculation of range is done by subtracting the smallest value from the largest value. This helps them learn & grasp how different and varied the numbers are within the data set. While a small range means low variability, a large range means high variability in a distribution.
Range of the Statistical Data Formula
The formula to calculate the range is as follows:
(Or)
R = H-L
where R = range
H = highest value
L = lowest value
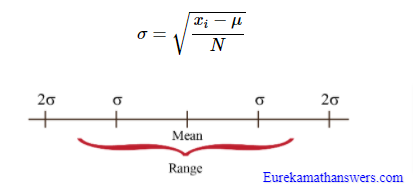
What is the Rule of Thumb?
According to the rule of thumb, the range of data lies within four standard deviations. Two above the mean and two below the mean. The formula for Standard Deviation (σ) is as follows.
How To Calculate Statistical Range with Example?
Calculating the range of statistical data is straightforward. In other words, it just needs to discover the variation between the numbers in a data set. Simply follow the basic steps available to find the range:
- Firstly, Order all the values in your data set from lowest to highest
- Find the minimum and maximum numbers which are required to substitute in the formula
- Then, Subtract the smallest number from the largest number.
- Finally, note down the range of a given data set.
For Example:
Find the range of the data 15, 3, 7, 87, 4, 33, 45, 32?
Solution:
Given data set is 15, 3, 7, 87, 4, 33, 45, 32
Now, arrange the list in ascending order i.e., 3, 4, 7, 15, 32, 33, 45, 87
By using the ordered set, find the smallest and largest values
Highest Value = 87
Lowest Value = 3
Range(R) = Highest Value – Lowest Value
= 87 – 3
= 84.
Limitations of Range
One of the most convenient metrics to calculate is range. However, it has subsequent conditions.
- It does not notify the number of data points.
- It is not utilized to find mean, median, or mode.
- The range of the statistical data can be changed by extreme values(outliers).
- However, it won’t work for open-ended distribution.
Real-Life Examples of Range in Statistics and Statistical Data
Example 1:
Your data set is the scores of 7 participants.
Participant: 1 2 3 4 5 6 7
Score: 37 18 31 28 21 26 32
Solution:
Given that,
Participant: 1 2 3 4 5 6 7
Score: 37 18 31 28 21 26 32
Firstly, arrange the values from low to high to identify the lowest value (L) and the highest value (H).
18, 21, 26, 28, 31, 32, 37
Now, subtract the lowest from the highest value to find the range:
R = H – L
R = 37 – 18 = 19
Hence, the range of our data set is 19 score.
Example 2:
The weights (in kg) of the teachers of a school are noted as 53, 60, 65, 63, 70, 65, 62, 65, 63, 64, 80, 60, 68, 58, 62, 65, 63, 65, 64, 60, 62, 63. What is the range of the collection?
Solution:
Given weights of teachers are 53, 60, 65, 63, 70, 65, 62, 65, 63, 64, 80, 60, 68, 58, 62, 65, 63, 65, 64, 60, 62, 63
Here, the least value = 53
the highest value = 80
The formula of Range = Maximum value – Minimum value
= 80 – 53
= 27.
Questions on Range in Statistics
1. Which of the following statements is true about the Range of the Statistical Data?
A. Sensitive only to outlier values
B. Gives equal weight to all observation
C. Gives the difference between the largest and the smallest
D. Most reliable measure of dispersion
2. Which of the following statements is true about the standard deviation of statistical data?
A. The least reliable measure of variability
B. The lower the value the more consistent the data
C. The simplest measure of variability
D. The higher the value the more consistent the data
3. Which of the following statements must be true?
A. The median of a data set must be smaller than its mode.
B. The standard deviation of a data set must be smaller than its mean.
C. The range of a data set must be smaller than its standard deviation.
4. If the lowest value is 15, and the range of the data is 3, what is the highest value?
A. 18
B. 14
C. 8
D. 55
FAQs on Range of Ungrouped Data
1. What is meant by range deviation?
The range deviation is the subtraction of minimum value from the maximum value and it represents the spread of data.
2. What is the formula of range?
The formula of the range is very easy, the difference between the largest value and the smallest value of the data set ie., Range (R) = Maximum Value – Minimum Value.
3. Solve the range of ungrouped data where the marks of a student in 4 tests of the chapter statistics are (out of 10) – 10, 7, 8, and 5.
Follow the below simple steps and find the range of ungrouped or raw data:
Step-1: Arrange the given marks in ascending order ie., 5, 7, 8, 10
Step-2: Now, take the range of the data formula and substitute the values ie., R = H – L = 10-5 = 5.
4. Can the range be a negative number?
As we know the formula of range, subtracts the lowest number from the highest number, the range is always zero or a positive number. So, it can’t be a negative number.
5. How to obtain the range of a function?
The set of all possible values which it can produce is defined as the range of a function. Hence, irrespective of what value we give to x, the function is always positive. If x is 4, then the function returns x as squared value i.e. 16.