To learn more about the Frequency Distribution of Grouped data and Ungrouped data this is the right place to learn, and to increase more knowledge on Frequency Distribution. Statistics is the study of collecting data, organization, interpretation, analysis, and data presentation. The main purpose of statistics is to plan the collected data in terms of the experimental designs and statistical surveys.
Statistical knowledge will help to collect the data in the proper method, and samples are employed in the correct analysis process, in order to effectively produce the results. In statistics, the Frequency distribution is a table that displays the number of outcomes of a sample. In this platform, we have to learn about Frequency Distribution definition, ungrouped data, grouped data advantages, and disadvantages.
Also, Read: Terms Related to Statistics
What is Frequency Distribution?
A frequency distribution can be defined as the tabulation of the values with one or more variables. A frequency distribution is a representation, either in a graphical format or tabular format, that displays the number of observations within a given interval. The interval size will depend on the data being analyzed and the goals of the analyst. The intervals must be mutually exclusive and exhaustive.
Basically, the Frequency distribution is typically used within a statistical context. A frequency distribution can be graphed as a histogram (or) pie chart. Frequency distributions are particularly useful for normal distributions, which show the observations of probabilities divided among standard deviations.
The tabular form of Frequency Distribution of statistics is shown below
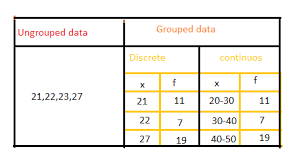
Frequency Distribution of Grouped Data
Grouped data means the data or information given in the form of class intervals. This information can also be displayed using a pictograph or a bar graph. Grouped data plays an important role when we have to deal large information or data. Arranging the individual observations of a variable into groups, so that the frequency distribution table of these groups provides a convenient way of summarizing or analyzing the data is termed grouped data.
The advantages of Frequency distribution grouped data are:
- It improves the accuracy and efficiency of estimation.
- It helps to focus on the important subpopulations and ignores irrelevant ones.
The disadvantages of grouping data are:
- Lose some of the details in the data.
- we cannot accurately calculate statistics such as the mean or median from a grouped data of frequency table is alone
Frequency Distribution Table of Grouped Data:
The frequency distribution of grouped data is to analyze when the collected data is large, we can follow this approach to analysed it easily. It is named tally marks.
Example of Frequency Distribution Grouped Data:
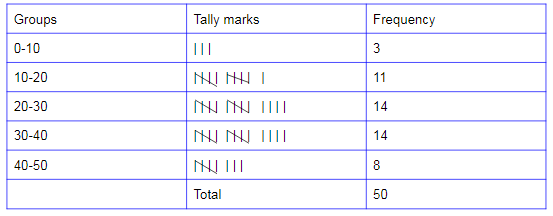
Consider the marks of 30 students of class VII obtained in an examination. The maximum marks of the exam are 50.
24, 6, 12, 17, 33, 45, 16, 7, 24, 28, 11, 31, 23, 40, 39, 16, 26, 9, 16, 20, 31, 25, 28, 18, 15, 33, 28, 47, 43, 21.
So, if we create a frequency distribution table for each and every observation, then it will form a large table. For easy understanding, we can make a table with a group of observations say that 0 – 10, 10 – 20, 20 – 30, 30 – 40, 40 – 50, and so on. We can form the data like the above table, easily understanding and faster-doing the calculation.
The distribution obtained in the above table is known as grouped data of frequency distribution. In that tabular form mention the data or marks in between 10 – 20, suppose 3 numbers will be there then the frequency is 3 like that you can counting or calculated the intervals, frequency will be noticed. But 20 will appear in both 10 to 20 and 20 to 30, 30 also will appear in both 20 to 30 and 30 to 40. But is not feasible that observation either 10 or 20 belong to two classes concurrently.
To avoid this inconsistency, we choose the rule that the general conclusion will belong to the higher class. It means that 10 belongs to the class interval 10-20 but not to 0-10, similarly 20 belongs to class interval of 20-30 but not to 10-20. This is how we create a frequency distribution table of grouped data.
Frequency Distribution of Ungrouped Data
Frequency Distribution of ungrouped data is a data given as individual data points. An ungrouped set of data is basically a list of numbers. Ungrouped data does not fall in any group, it still raw data.
The advantages of ungrouped data frequency distribution are :
- Most people can easily interpret it.
- When the sample size is small, it is easy to calculate the mean, mode and median.
- It does not require technical expertise to analyze it.
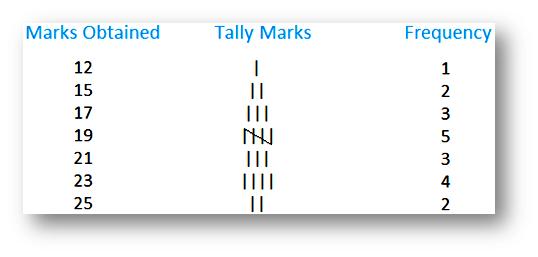
Frequency Distribution Table of Ungrouped Data
The data is raw that means it cannot sorted in to categories, classified, or otherwise grouped. An ungrouped set of data is basically a list of numbers. The ungrouped data of frequency distribution table is as shown below,
The following rules must be completed in order to create an ungrouped data frequency distribution :
- Set the values of data, which are called scores, in the column starting from the lowest value to the highest or vice versa.
- Create the second column with the frequency of each data occurrence. This column is known as the tally of the scores.
- Create the third column, where the relative frequency of each score will be inserted. The relative frequency can be obtained as follows: fr = f/N, where f is the frequency of each score from the second column and N is the total number of scores. In order to check the correctness of calculations, the sum of fr should be calculated and should be equal to 1.
- The next column, where the relative frequency will be performed in percentages, is to be created.
- In the next column, known as the cumulative frequency column, the cumulative frequency for each score should be estimated. Calculation of the cumulative frequncy should be started from the lowest value of score, for which the cumulative frequency equals the value of frequency from the second column.
- The further calculations are to be performed for each score in a sequence from lowest to highest and the cumulative frequency for each next score equals to the sum of the cumulative frequency of the previous score and frequency of this score from the second column. The cumulative frequency of the highest score should be equal to the total number of scores.
- The next column is called “cumulative proportion” and the values of its column are obtained as a ratio of cumulative frequency for each score and the total number of scores.
- The last column is the cumulative percent, where the cumulative proportion is presented as percentages.
Difference between Grouped Data and Ungrouped Data
Based on Classification, Accuracy, Summarization of grouped data and ungrouped data difference are listed below:
- Classification: Grouped data is organized into forms whereas Ungrouped data has no forms of organisation.
- Accuracy: Grouped data has higher accuracy levels when calculating mean and median, whereas ungrouped data has less accurate in determining the mean and median.
- Preference: Grouped data preferred the analyzing data whereas ungrouped data preferred the collecting data.
- Summary : Grouped data is summarised in a frequency distribution, while the ungrouped data has no summarization.
- The representation of grouped data and ungrouped data of frequency distribution is as shown below: