Go through the enVision Math Common Core Grade 7 Answer Key Topic 6 Use Sampling to Draw Inferences About Populations and finish your homework or assignments.
enVision Math Common Core 7th Grade Answers Key Topic 6 Use Sampling To Draw Inferences About Populations
TOPIC 6 GET READY!
Review What You Know!
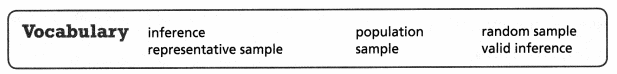
Vocabulary
Choose the best term from the box to complete each definition.
Question 1.
A ____ is how data values are arranged.
Answer:
Data Distribution,
Explanation:
A data distribution is how data values are arranged.
Question 2.
The part of a data set where the middle values are concentrated is called the ___ of the data
Answer:
Center,
Explanation:
The part of a data set where the middle values are concentrated is called the center of the data.
Question 3.
A ___ anticipates that there will be different answers when gathering information.
Answer:
Statistical Question,
Explanation:
A statistical question anticipates that there will be different answers when gathering information.
Question 4.
____ is a measure that describes the spread of values in a data set.
Answer:
Variability,
Explanation:
Variability is a measure that describes the spread of values in a data set.
Statistical Measures
Use the following data to determine each statistical measure.
9, 9, 14, 7, 12, 8, 11, 19, 15, 11
Question 5.
mean : Add all the given numbers, then divide by the amount of numbers
Answer:
Mean is 11.5,
Explanation :
Sum or total = 9+9+14+7+12+8+11+19+15+11=115 (total of given numbers)
MEAN = 115/10=11.5.
Question 6.
median :
7,8,9,9,11,11,12,14,15,19
Answer:
Median is Eleven (11),
Explanation:
Put the numbers from smallest to the largest, the number in the middle is Median,
if two numbers are in the middle, then add them and divide by 2.
Median = (11+11)/2 = 22/2 = 11.
Question 7.
range
Answer:
Range is Twelve (12),
Explanation:
The range is the difference between the lowest to the highest value in the
given numbers 7,8,9,9,11,11,12,14,15,19,
Lowest number is : 7
Highest number is : 19
Range = 19 – 7 = 12.
Question 8.
mode
Answer:
Mode is Two (2),
Explanation:
The value around which there is the greatest concentration is called mode.
Count how many of each value appears in the given numbers or values
Here the modes are 2, that is 9, 9 and 11,11
Mode =3(Median) – 2(Mean),
= 3(11) – 2(11.5),
= 33 – 23,
= 10.
Question 9.
inter quartile range (IQR)
Answer:
Inter quartile Range is Five (5),
Explanation:
Given statistical measures : 9, 9, 14, 7, 12, 8, 11, 19, 15, 11
Arranged in order 7,8,9,9,11,11,12,14,15,19
First half 7,8,9,9,11,
second half 11,12,14,15,19.
Quartiles : The observations which divide the whole set of observations into four equal parts.
lower quartile LQ : Mid number of or median of a given series
First half is lower quartile LQ = 9,
Upper quartile UQ : Mid number of or median of a given series
second half is lower quartile, UQ = 14
interquartile range(IQR) : The difference between the upper quartile and
the lower quartile is called the interquartile range(IQR)
IQR= UQ – LQ = 14 – 9 = 5.
Question 10.
mean absolute deviation (MAD)
Answer:
MAD is 2.8,
Explanation:
The mean absolute deviation of a data set is the average distance between
each data point and the mean. It gives us an idea about the variability in a data set
Step 1:
Calculate the mean.
sum or total = 9+9+14+7+12+8+11+19+15+11=115 (total of given numbers)
MEAN = 115/10=11.5,
Step 2:
Calculate how far away each data point is from the mean using positive distances.
These are called absolute deviations.
Data Point Distance from Mean
1) 9 I 9 – 11.5 I = 2.5
2) 9 I 9 – 11.5 I = 2.5
3) 14 I 14 – 11.5 I = 2.5
4) 7 I 7 – 11.5 I = 4.5
5) 12 I 12 – 11.5 I =0.5
6) 8 I 8 – 11.5 I = 3.5
7) 11 I 11 – 11.5 I = 0.5
8) 19 I 19 – 11.5 I = 7.5
9) 15 I 15 – 11.5 I = 3.5
10) 11 I 11 – 11.5 I = 0.5
Total measure is 2.5+2.5+2.5+4.5+0.5+3.5+0.5+7.5+3.5+0.5=28.0,
Divide the total measure by the number of observation = 28.0/10 =2.8,
MAD = 28/10 = 2.8.
Data Representations
Make each data display using the data from Problems 5-7.
Question 11.
Answer:
Displayed data is collected from problems 5-7,
Box Plot :
a simple way of representing statistical data on a plot in which a rectangle is drawn to
represent the second and third quartiles, usually with a vertical line inside to
indicate the median value. The lower and upper quartiles are shown as horizontal lines
either side of the rectangle.
Explanation:
Box plot: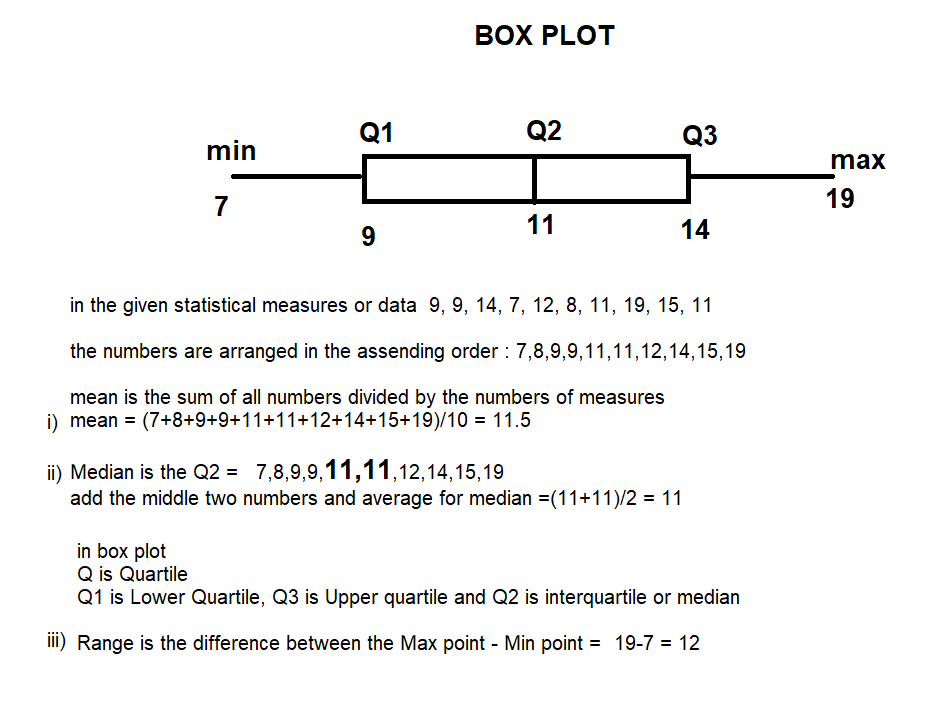
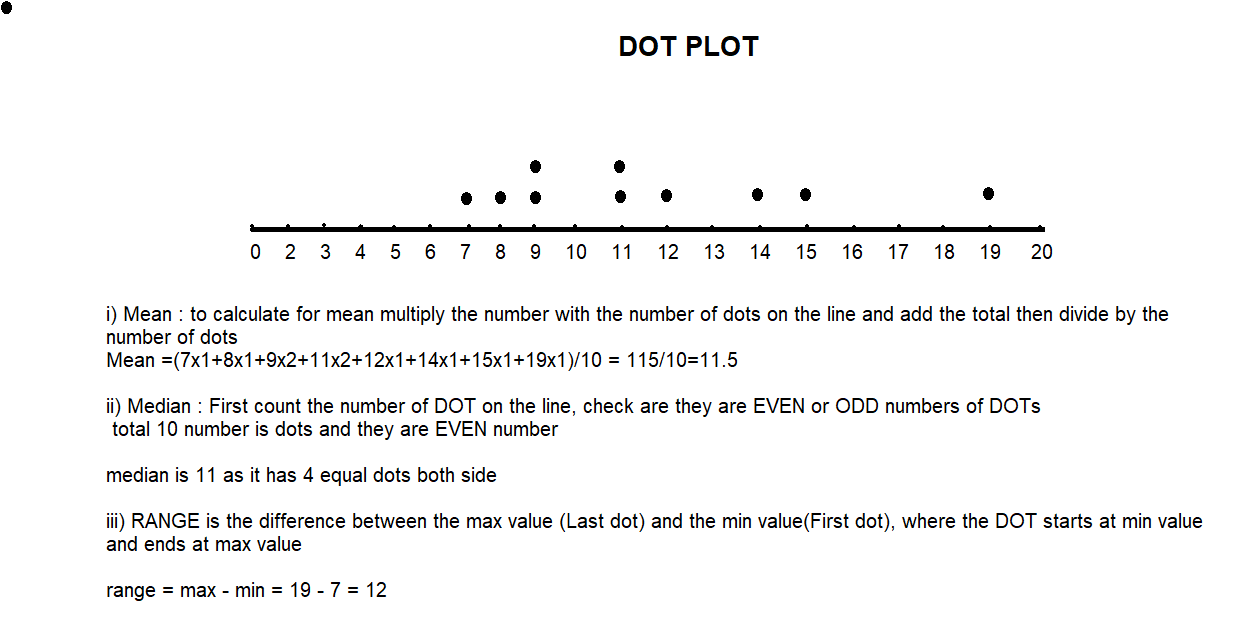
Question 12.
Dot plot
Answer:
Dot Plot:
A dot plot, also known as a strip plot or dot chart, is a simple form of data visualization
that consists of data points plotted as dots on a graph with an x- and y-axis.
These types of charts are used to graphically depict certain data trends or groupings.
Explanation:
Statistical Questions
Question 13.
Which is NOT a statistical question that might be used to gather data from a certain group?
A. In what state were you born?
B. What is the capital of the United States?
C. How many pets do you have?
D. Do you like strawberry yogurt?
Answer :
B is NOT statistical questions
Explanation :
A statistical question anticipates that there will be different answers when gathering information, where as Capital of United States is the same answer, so the question What is the capital of the United States? might be used to gather data from a certain group.
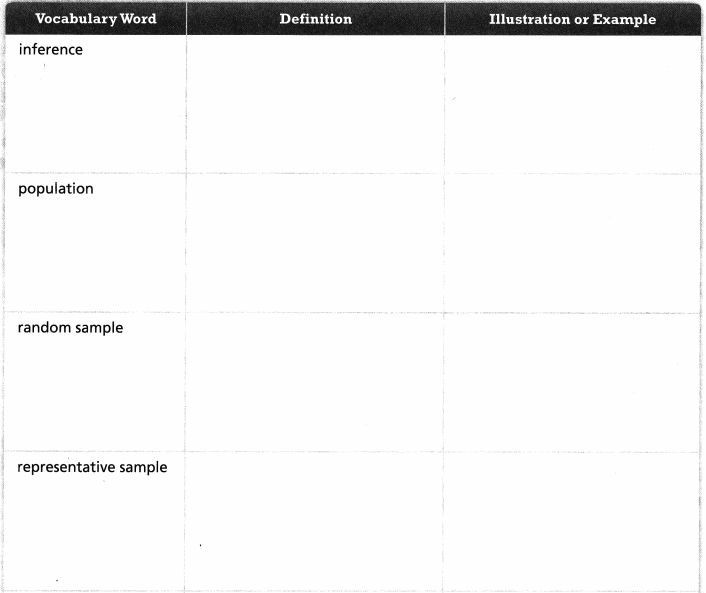
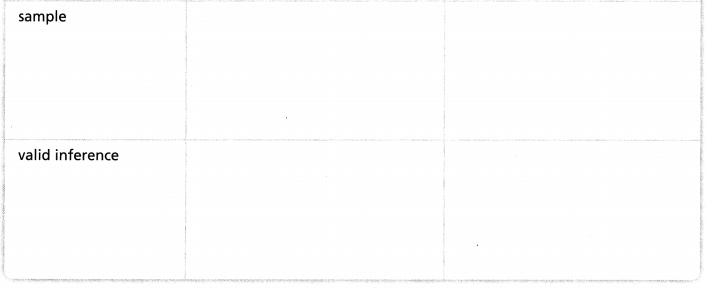
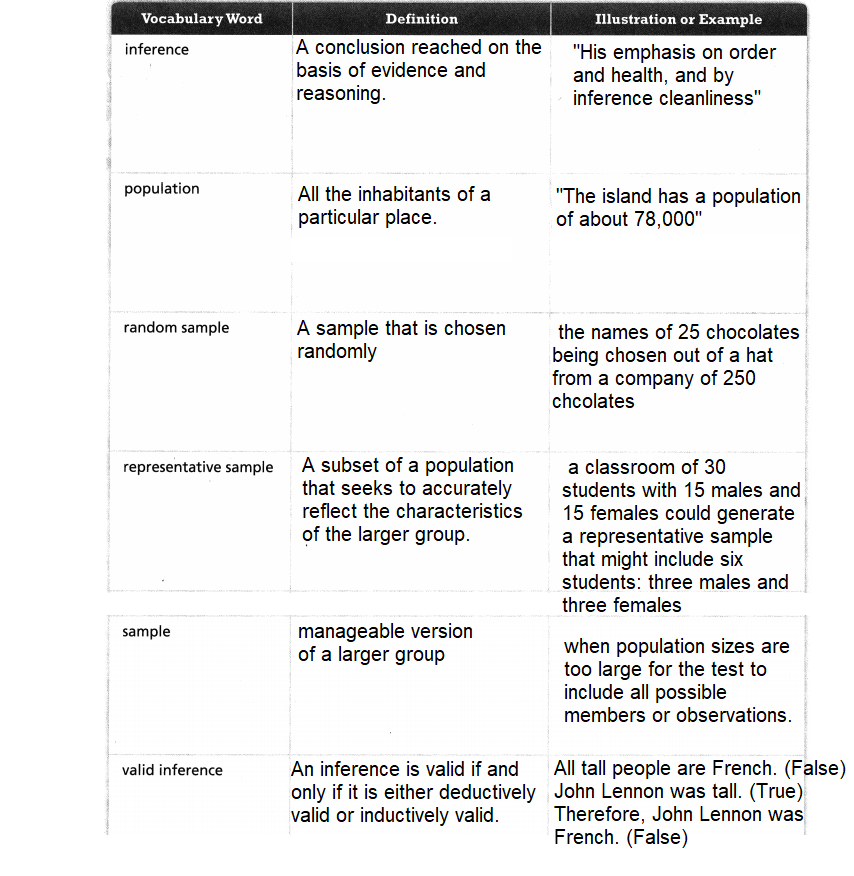
Language Development
Fill in the graphic organizer. Write each definition in your own words. Illustrate or cite supporting examples.
Answer:
PICK A PROJECT
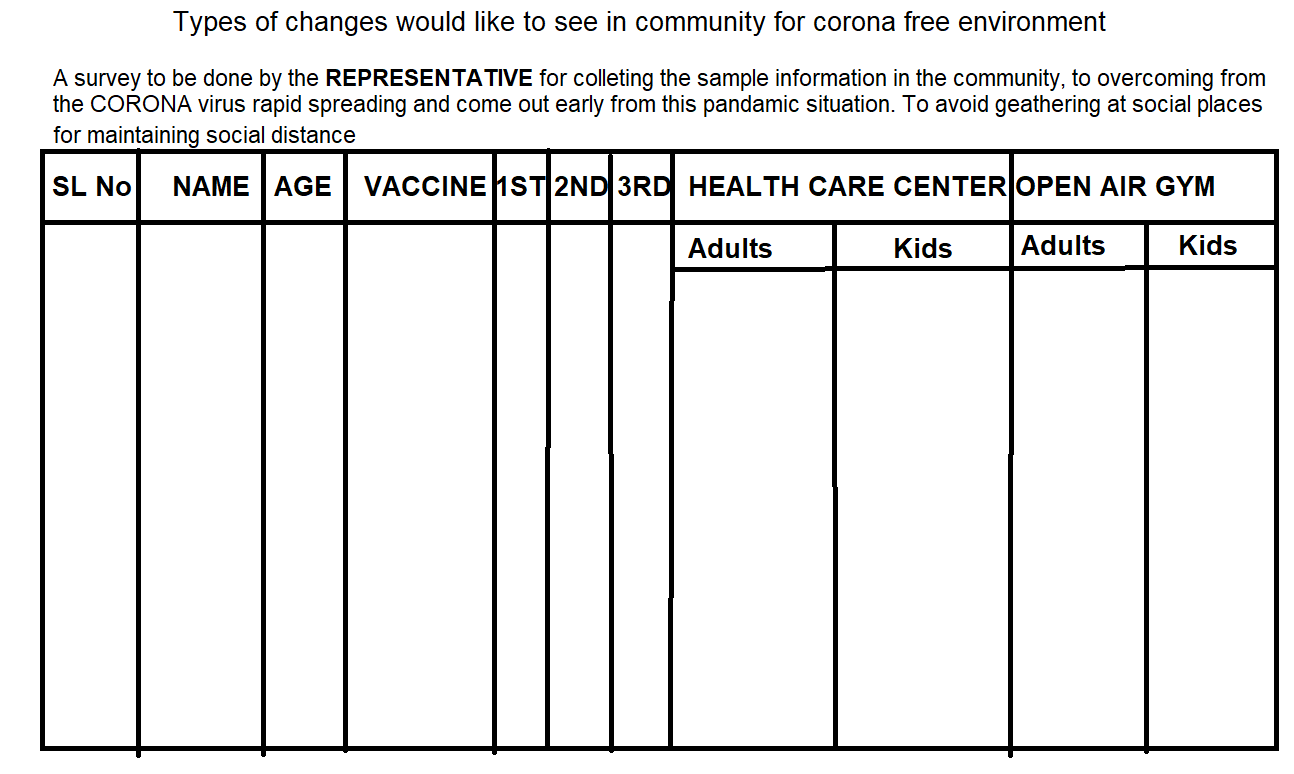
PROJECT 6A
What types of changes would you like to see in your community?
PROJECT: WRITE TO YOUR REPRESENTATIVE
Answer:

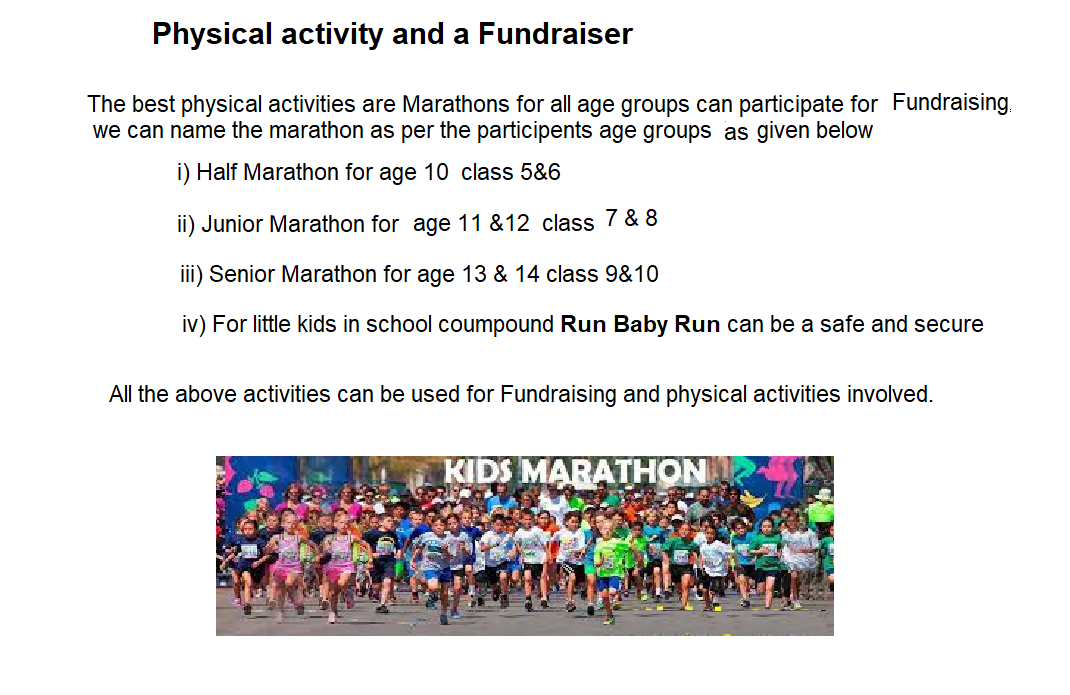
PROJECT 6B
How could you combine physical activity and a fundraiser?
PROJECT: ANALYZE AN ACTIVITY
Answer:
Physical Activity Marathon is one of the fundraiser.
Explanation:
PROJECT 6C
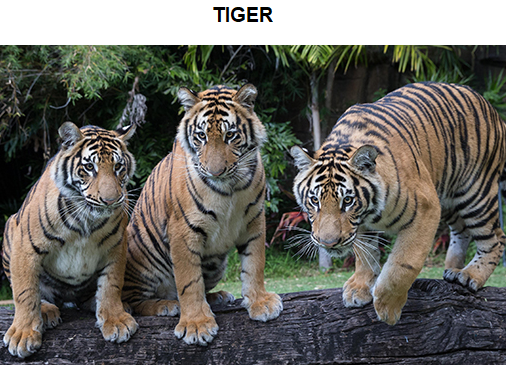
If you could study an animal population in depth, which animal would you choose, and why?
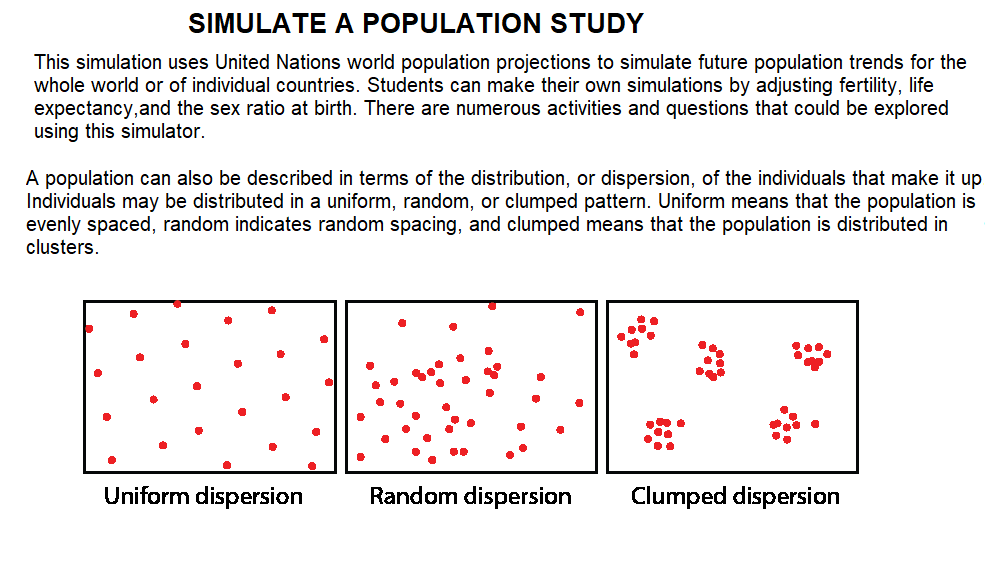
PROJECT: SIMULATE A POPULATION STUDY
Answer : Tiger
After a century of decline, overall wild tiger numbers are starting to tick upward. Based on the best available information, tiger populations are stable or increasing in India, Nepal, Bhutan, Russia and China.
PROJECT 6D
If you were to design a piece of art that moved, how would you make it move?
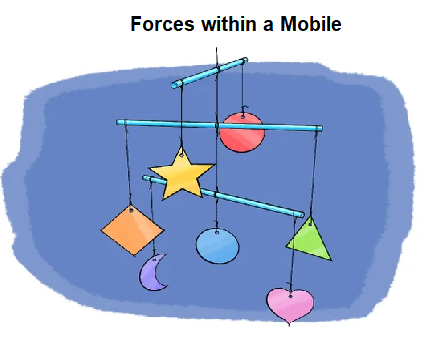
PROJECT: BUILD A MOBILE

Answer:
Explanation:
Mobiles are free-hanging sculptures that can move in the air. These sculptures are not only artistic, but they are also a great demonstration of balanced forces. If you look at a traditional mobile more closely you will usually notice that it is made of various horizontal rods.
Materials:
Heavy construction paper or cardstock (various colors work well)
Hole punch, Pen, Markers, Scissors, Tape, String, Straws, at least 6
Ceiling or doorframe you can hang the mobile from (and a chair or adult to help in hanging it)
Preparation:
Carefully cut out the different shapes with your scissors. If you like, you can decorate each of them.
Punch a hole into the top center of each of the cut-out shapes.Attach a piece of string to each of the shapes by threading it through the punched hole and tying a knot. Try to vary the length of string attached to each shape so that they are not all the same.
Procedure:
Start with one layer of your mobile. Attach a piece of string to the center of one of your straws. Hold the straw by the string so it is hanging freely in the air. Once the straw is balanced tie your first shape to one end of the straw.Tie a second shape to the other end of the straw then hold the straw up in the air again.Balance the straw by moving one of the shapes along the straw. Use a second straw and two more shapes to build another balanced structure.
Lesson 6.1 Populations and Samples
Solve & Discuss It!
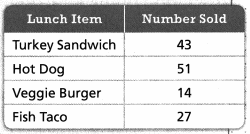
The table shows the lunch items sold on one day at the middle school cafeteria. Use the given information to help the cafeteria manager complete his food supply order for next week.
Generalize
what conclusions can you draw from the lunch data?
Answer:
Highest Sold items are Hot Dog and least sold items are Veggie Burger.
Explanation:
In the middle school cafeteria Highest Sold items are Hot Dog and least sold items are Veggie Burger, this information help the cafeteria manager to complete his food supply order for next week.
Focus on math practices
Construct Arguments Why might it be helpful for the cafeteria manager to look at the items ordered on more than one day?
Sales of food items information to help the cafeteria manager complete his food supply order to avoid wastage of excess food items and the loos occur due to the less or non saleable items.
Essential Question
How can you determine a representative sample of a population?
Answer:
A subset of a population that seeks to accurately reflect the characteristics of the larger group.
Explanation:
In case of Morgan and her friends are sub set of the registered voted of Morgan town for construction of new stadium.
Try It!
Miguel thinks the science teachers in his school give more homework than the math teachers. He is researching the number of hours middle school students in his school spend doing math and science homework each night.
Answer:
The population includes all the students in Miguel’s middle school.
A possible sample is some students from each of the grades in the middle school.
Convince Me!
Why is it more efficient to study a sample rather than an entire population?
Answer:
To study the whole population is often very expensive and time consuming because of the number of people involved.
For example every 10th person of the population and reduce the time by 10 and still get a representative results.
Try It!
A produce manager is deciding whether there is customer demand for expanding the organic food section of her store. How could she obtain the information she needs?
Answer:
The manager can interview the customers random sample for customer demand for expanding the organic food section of her store. As a sample out of the population.
Try It!
Ravi is running against two other candidates for student council president. All of the 750 students in Ravi’s school will vote for student council president. How can Ravi generate a representative sample that will help him determine whether he will win the election?
Answer:
Ravi can ask one in every 10 people to reduce the number of people he needs to interview in order to make a sample out of 750 students, as we know that a random sample 75 students, Ravi generate a representative sample that will help him determine whether he will win the election.
Try It!
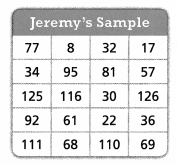
The table at the right shows the random sample that Jeremy generated from the same population as Morgan’s and Maddy’s samples. Compare Jeremy’s sample to Morgan’s and Maddy’s.
Answer :
Jeremy’s sample also contains 20samples. and the sample shares the value 36 with Morgan’s sample and one value 126 with Maddy’s sample, the distribution of values in Jeremy’s sample is different then that of Morgans and Maddy.
KEY CONCEPT
A population is an entire group of objects-people, animals, plants—from which data can be collected. A sample is a subset of the population. When you ask a statistical question about a population, it is often more efficient to gather data from a sample of the population.
A representative sample of a population has the same characteristics as the population. Generating a random sample is one reliable way to produce a representative sample of a population. You can generate multiple random samples that are different but that are each representative of the population.
Do You Understand?
Question 1.
Essential Question
How can you determine a representative sample of a population?
Answer:
A representative sample of a population has the same characteristics as the population but generating a random sample.
Question 2.
Construct Arguments Why does a sample need to be representative of a population?
Answer:
A sample is need for Reliability.
Explanation:
A random sample is one reliable way to produce a representative sample of a population.
Question 3.
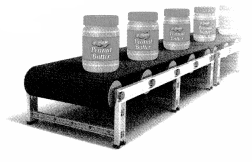
Be Precise The quality control manager of a peanut butter manufacturing plant wants to ensure the quality of the peanut butter in the jars coming down the assembly line. Describe a representative sampling method she could use.
Answer:
The quality control manager of a peanut butter manufacturing plant must adopt repeat in line quality checking method to ensure of the quality of the peanut butter in the jar coming down the assembly line. the manager or representative must check every 4th peanut butter jars coming down.
Do You Know How?
Question 4.
A health club manager wants to determine whether the members would prefer a new sauna or a new steam room. The club surveys 50 of its 600 members. What is the population of this study?
Answer:
The population of this study is 600.
Question 5.
A journalism teacher wants to determine whether his students would prefer to attend a national writing convention or tour of a local newspaper press. The journalism teacher has a total of 120 students in 4 different classes. What would be a representative sample in this situation?
Answer:
Representative sample is Four(4)
Explanation:
The journalism teacher will prefer 4 representatives, one sample from each class. total 4 representative sample for collecting the student prefer for attending National writing convention or Local newspaper press.
Question 6.
Garret wants to find out which restaurant people think serves the best beef brisket in town.
a. What is the population from which Garret should find a sample?
b. What might be a sample that is not representative of the population?
Answer:
a. A population is an entire group of people in the town visits restaurant for the best beef brisket.
b. A representative sample of a population in a restaurant is who does not prefer the beef brisket.
Practice & Problem Solving
Leveled Practice In 7 and 8, complete each statement with the correct number.
Question 7.
Of a group of 200 workers, 15 are chosen to participate in a survey about the number of miles they drive to work each week.
Answer:
Sample consists of 15 workers out of 500.
Explanation:
In this situation, the sample consists of the 15 workers selected to participate in the survey are random samples.
The population consists of 200 workers.
Question 8.
The ticket manager for a minor league baseball team awarded prizes by drawing four numbers corresponding to the ticket stub numbers of four fans in attendance.
Answer:
In this situation, the sample consists of the 4 people selected to win a prize.
Explanation:
The population consists of 4 the spectators who purchased tickets to attend the game.
Question 9.
A supermarket conducts a survey to find the approximate number of its customers who like apple juice. What is the population of the survey?
Answer:
Representative Sample survey.
Explanation:
A representative sample of a population has the same characteristics as the population. All the population of from that town.
Question 10.
A national appliance store chain is reviewing the performances of its 400 sales associate trainees. How can the store choose a representative sample of the trainees?
Answer:
Random Sample.
Explanation:
Random sampling is a part of the sampling in which each sample has an equal probability of being chosen.
Of the 652 passengers on a cruise ship, 30 attended the magic show on board.
a. What is the sample?
b. What is the population?
Answer:
a. sample is 30
b. population is 652
Explanation:
Total number of passengers is equal to the population in ship i.e.,652
Out of which 30 attended magic show, so the sample became 30.
Question 12.
Make Sense and Persevere
The owner of a landscaping company is investigating whether his 120 employees would prefer a water cooler or bottled water. Determine the population and a representative sample for this situation.

Answer:
The Population is 120 employees.
Explanation:
A representative sample is a subset of a population that seeks to accurately reflect the characteristics of the larger group that is 120employees, 12 employees can be considered as representative sample for investigating whether his 120 employees would prefer a water cooler or bottled water.
Question 13.
Higher Order Thinking
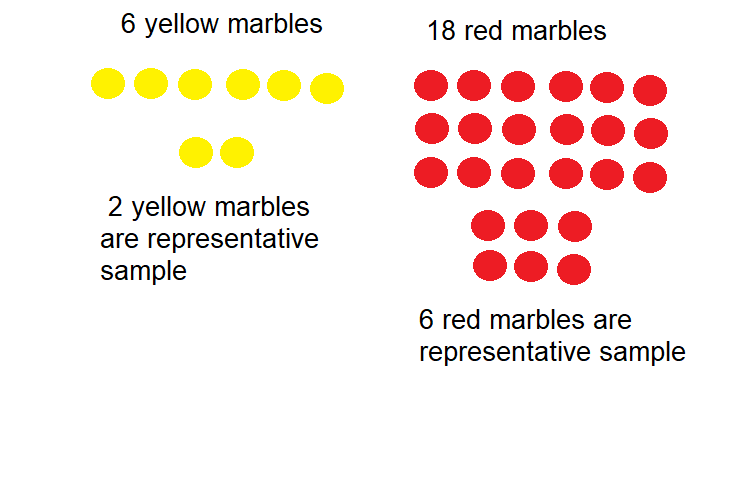
A bag contains 6 yellow marbles and 18 red marbles. If a representative sample contains 2 yellow marbles, then how many red marbles would you expect it to contain? Explain.
Answer:
6 marbles are expected.
Explanation:
Question 14.
Chung wants to determine the favorite hobbies among the teachers at his school. How could he generate a representative sample? Why would it be helpful to generate multiple samples?
Answer:
A representative sample is a subset of a population that seeks to accurately reflect the characteristics of the larger group.
It would be helpful to determine the favorite hobbies among teachers.
Explanation:
For example,
A classroom of 30 teachers with 15 males and 15 females could generate a representative sample,
it can help to generate multiple samples, to determine favorite hobbies.
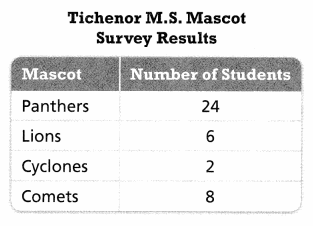
Question 15.
The table shows the results of a survey conducted to choose a new mascot. Yolanda said that the sample consists of all 237 students at Tichenor Middle School.
a. What was Yolanda’s error?
Answer:
Yolanda’s error is the total population is all students must be a round figure 240
Explanation:
Errors happen when you take a sample from the population rather than using the entire population. In other words, it’s the difference between the statistic you measure and the parameter you would find if you took a census of the entire population.
Then 24 out of 240 be a 10% sample
Instead of 24 of 237 is 10.12%
Main reason for sample size in the population is important.
b. What is the sample size? Explain.
Answer:
sample size is 40.
A sample size is a part of the population chosen for a survey or experiment.
Explanation:
For example, you might take a survey of car owner’s brand preferences. You won’t want to survey all the millions of Cars owners in the country, so you take a sample size. That may be several thousand owners. The sample size is a representation of all car owner’s brand preferences. If you choose your sample wisely, it will be a good representation.
Question 16.
Reasoning
To predict the outcome of the vote for the town budget, the town manager assigned random numbers and selected 125 registered voters. He then called these voters and asked how they planned to vote. Is the town manager’s sample representative of the population? Explain.
Answer:
YES, the town manager’s sample representative of the population.
Explanation:
A representative sample is where your sample matches some characteristic of your population, usually the characteristic you’re targeting with your research. the town manager selected 125 registered voters randomly to ask how they plan to vote.
Question 17.
David wants to determine the number of students in his school who like Brussels sprouts. What is the population of David’s study?
Answer:
The population of David’s Study is the the number of students in his school those who like brussels sprouts and dose not like.
Explanation:
A population is a whole, it’s every member of a group. A population is the opposite to a sample, which is a fraction or percentage of a group.
Question 18.
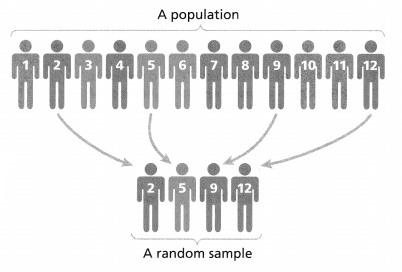
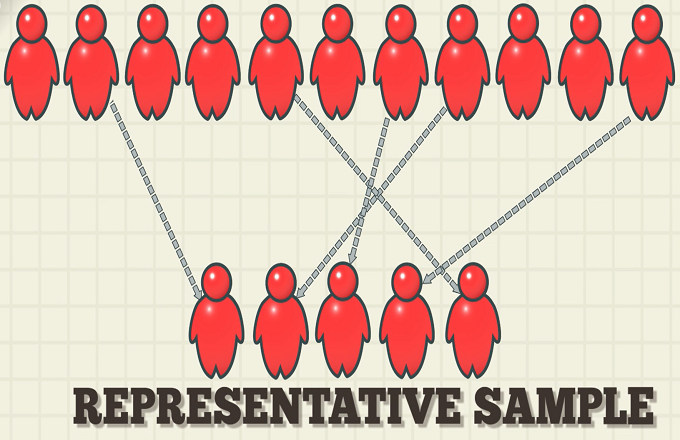
Researchers want to determine the percentage of Americans who have visited The Florida Everglades National Park in Florida. The diagram shows the population of this study, as well as the sample used by the researchers. After their study, the researchers conclude that nearly 75% of Americans have visited the park.
a. What error was likely made by the researchers?
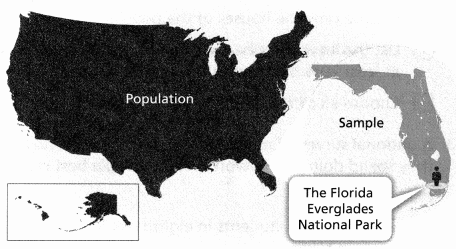
Answer:
A sampling error is a statistical error that occurs when an analyst does not select a sample that represents the entire population of data. As a result, the results found in the sample do not represent the results that would be obtained from the entire population. Here the researchers conclude that nearly 75% of Americans have visited the park.
b. Give an example of steps researchers might take to improve their study.
Answer:
Sampling errors are easy to identify. Here are a few simple steps to reduce sampling error:
- Increase sample size: A larger sample size results in a more accurate result because the study gets closer to the actual population size.
- Divide the population into groups: Test groups according to their size in the population instead of a random sample. For example, if people of a specific demographic make up 20% of the population, make sure that your study is made up of this variable.
- Know your population: Study your population and understand its demographic mix. Know what demographics use your product and service and ensure you only target the sample that matters.
Question 19.
An art teacher asks a sample of students if they would be interested in studying art next year. Of the 30 students he surveys, 81% are already enrolled in one of his art classes this year. Only 11% of the school’s students are studying art this year. Did the teacher survey a representative sample of the students in the school? Explain.

Answer:
The teacher surveys 30 students, total population of the school is not given to infer the survey results.
Question 20.
Make Sense and Persevere
A supermarket wants to conduct a survey of its customers to find whether they enjoy oatmeal for breakfast. Describe how the supermarket could generate a representative sample for the survey.
Answer:
The manager of the super market can interview people at random.
for example in the store every 10th customer use the random sample as a representative sample of the population, enjoy oatmeal for breakfast.
Question 21.
Critique Reasoning
Gwen is the manager of a clothing store. To measure customer satisfaction, she asks each shopper who makes big purchases for a rating of his or her overall shopping experience. Explain why Gwen’s sampling method may not generate a representative sample.
Answer: In general customer visit the store with positive attitude and satisfaction. Here the mistake made by Gwen was sampling big purchases customer for a rating of his or her overall shopping experience rather then considering all the customers of a clothing store.
Assessment Practice
Question 22.
Sheila wants to research the colors of houses on a highly populated street. Which of the following methods could Sheila use to generate a representative sample? Select all that apply.
![]() Assign each house a number and use a random number generator to produce a list of houses for the sample.
Assign each house a number and use a random number generator to produce a list of houses for the sample.
![]() Choose every house that has at least 3 trees in the front yard.
Choose every house that has at least 3 trees in the front yard.
![]() Choose only the houses of the people you know.
Choose only the houses of the people you know.
![]() List the house numbers on slips of paper and draw at least 20% of the numbers out of a box.
List the house numbers on slips of paper and draw at least 20% of the numbers out of a box.
![]() Choose all of the houses on the street that have shutters.
Choose all of the houses on the street that have shutters.
Answer:
The statements that apply are
Assign each house a number and use a random number generator to produce a list of houses for the sample
List the house numbers on slips of paper and draw at least 20% of the numbers out of a box.
Question 23.
A national survey of middle school students asks how many hours a day they spend doing homework. Which sample best represents the population?
PART A
A. A group of 941 students in eighth grade in
B. A group of 886 students in sixth grade in a certain county
C. A group of 795 students in seventh grade in different states
D. A group of 739 students in different middle school grade levels from various states
Answer: D
D. A group of 739 students in different middle school grade levels from various states
is correct
PART B
Explain the reasoning for your answer in Part A.
Answer:
Option D is the only answer that covers multiple grades in different states of the country. That way we have the most representative sample among those four.
Lesson 6.2 Draw Inferences from Data
Solve & Discuss It!
The students in Ms. Miller’s class cast their votes in the school-wide vote for which color to paint the cafeteria walls. Based on the data, what might you conclude about how the rest of the school will vote?
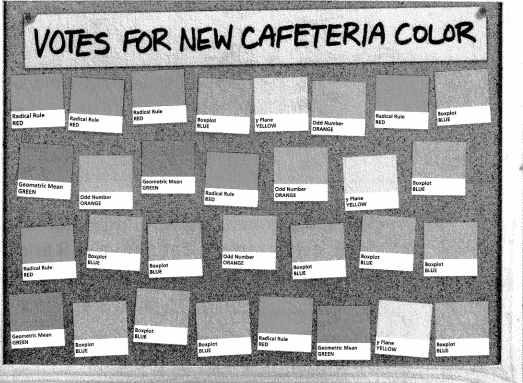
Make Sense and Persevere
How many students are in Ms. Miller’s class? How many students voted for each color?
Answer:
30 students are in Ms. Miller’s class.
Explanation:
Number of students voted for each color.
Radical Rule RED = 7
Box plot BLUE = 12
Geometric mean GREEN = 4
y Plane YELLOW = 3
odd Number ORANGE = 4
Focus on math practices
Reasoning How can you determine whether a sample is representative of a population?
Answer :
Reliability
Explanation:
A sample is a subset of the population. A representative sample of a population has the same characteristics as the population. Generating a random sample is one reliable way to produce a representative sample of a population.
Essential Question
How can inferences be drawn about a population from data gathered from samples?
Answer:
By using sample statistics.
Explanation:
A samples are referred to as sample statistics while values concerning a population are referred to as population parameters. The process of using sample statistics to make conclusions about population parameters is known as inferential statistics.
Try It!
Dash collects data on the hair lengths of a random sample of seventh-grade boys in his school.
Answer:
The data are clustered between 1/2 and 2 inches and between 3½ and 4½ inches. Dash can infer from the data that seventh-grade boys in his school have both short and long hair.
Convince Me!
How does a dot plot help you make inferences from data?
Answer :
A Dot Plot is a type of simple histogram-like chart used in statistics for relatively small data sets where values fall into a number of discrete bins
Try It!
Alexis surveys three different samples of 20 students selected randomly from the population of 492 students in the seventh grade about their choice for class president. In each sample, Elijah receives the fewest votes. Alexis infers that Elijah will not win the election. Is her inference valid? Answer:
Yes, Her inference valid.
explanation:
More then 10% for population 492 is surveyed by Alexis by selecting 20 students of 3 groups is total 60 students, Elijah receives less votes.
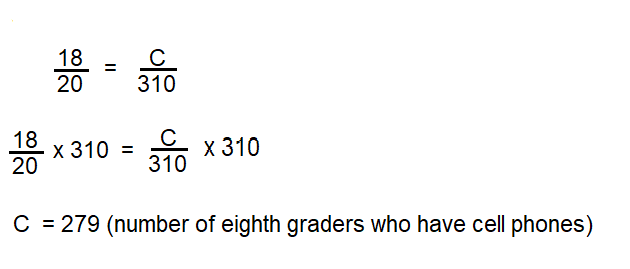
Try It!
For his report, Derek also collects data from a random sample of eighth graders in his school, and finds that 18 out of 20 eighth graders have cell phones. If there are 310 eighth graders in his school, estimate the number of eighth graders who have cell phones.
Answer:
The number of eighth garden who have cell phones are 279.
Explanation:
KEY CONCEPT
You can analyze numerical data from a random sample to draw inferences about the population. Measures of center, like mean and median, and measures of variability, like range, can be used to analyze the data in a sample.
Do You Understand?
Question 1.
Essential Question
How can inferences be drawn about a population from data gathered from samples?
Answer:
Inferential statistics is a way of making inferences about populations based on samples.
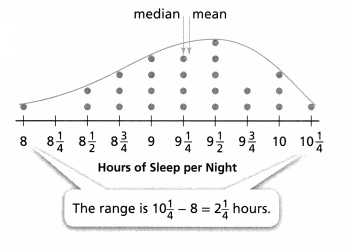
Explanation:
The inferences about the population Hours of sleep per night is 9pm to 9:30pm has more population
Question 2.
Reasoning Why can you use a random sample to make an inference?
Answer:
A random sample is the subset of the population selected without bias in order to make inferences about the entire population.
Explanation:
Random samples are more likely to contain data that can be used to make predictions about a whole population. The size of a sample influences the strength of the inference about the population.
Question 3.
Critique Reasoning
Darrin surveyed a random sample of 10 students from his science class about their favorite types of TV shows. Five students like detective shows, 4 like comedy shows, and 1 likes game shows. Darrin concluded that the most popular type of TV show among students in his school is likely detective shows. Explain why Darrin’s inference is not valid.
Answer:
Darrin’s inference is not valid because he concluded on most of the students like detective shows.
Explanation:
Out of 10 sample students
5 like – detective shows
4 like – comedy shows
1 like – game shows
Darrin’s concluded on most of the students like detective shows.
Do You Know How?
Question 5.
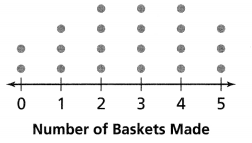
In a carnival game, players get 5 chances to throw a basketball through a hoop. The dot plot shows the number of baskets made by 20 different players.
a. Make an inference by looking at the shape of the data.
Answer:
Total 20 players, each player get 5 chance, except 2 players, 18 players throw a basketball through a hoop successfully.
Explanation:
2 players – Zero out of five score
3 players – 5 out of five score
3 players – 1 out of five score
4 players – 2 out of five score
4 players – 3 out of five score
4 players – 4 out of five score
b. What is the median of the data? What is the mean? Do these measures of center support the inference you made in part (a)?
Answer:
Median = 10
Explanation:
Throw a basketball through a hoop if we arrange in ascending order 0,3,8,12,15,16 as the measures, and the average of 8 and 12 will be the median
(8+12)/2=20/2=10
Answer:
Mean = 9
Explanation:
If we add all the measures and divided by the number as shown below
(0+3+8+12+15+16)/6=54/6=9
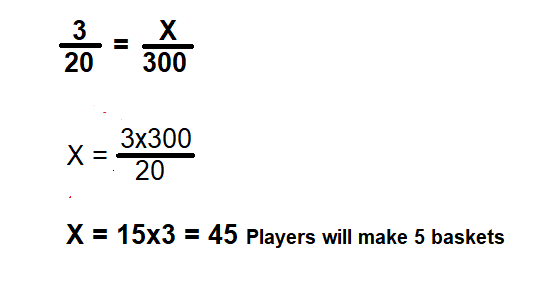
Question 6.
In the dot plot above, 3 of 20 players made all 5 baskets. Based on this data, about how many players out of 300 players will make all 5 baskets?
Answer:
45 players will make all 5 baskets.
Explanation:
3 of 20 players made 5 baskets
X of 300 players will make 5 baskets
cross multiply as shown below
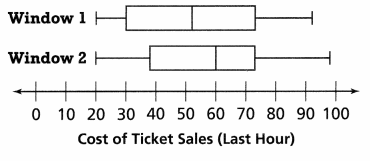
Question 7.
The manager of a box office gathered data from two different ticket windows where tickets to a music concert were being sold. Does the data shown in the box plots below support the inference that most of the tickets sold were about $40? Explain.
Answer:
NO, the box plot will not support the inference.
Explanation :
As per the Box Plot most of the tickets sold were about $50 to $60 as IQR or Q2 lies between the 50-60
Practice & Problem Solving
Leveled Practice In 8-10, use the sample data to answer the questions.
Alicia and Thea are in charge of determining the number of T-shirts to order to sell in the school store. Each student collected sample data from the population of 300 students. Alicia surveyed 50 students in the cafeteria. Thea surveyed the first 60 students who arrived at school one morning.
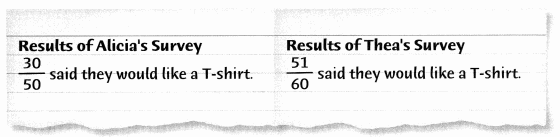
Question 8.
Use Alicia’s data to estimate the number of T-shirts they should order.
Answer:
180 T- shirts should be order.
Explanation:
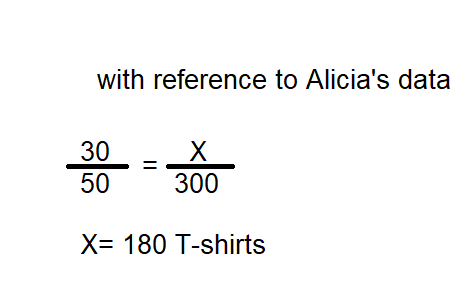
They should order about 180 T-shirts.
Question 9.
Use Thea’s data to estimate the number of T-shirts they should order.
Answer:
255 T-shirts should be order.
Explanation:
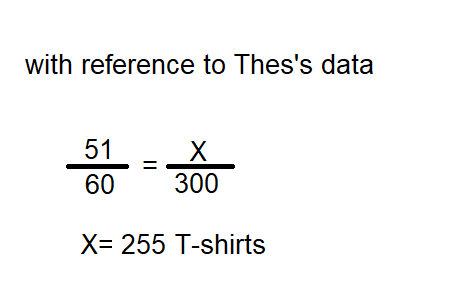
They should order about 255 T-shirts
Question 10.
Construct Arguments Can Alicia or Thea make a valid inference? Explain.
Answer:
Thea : As per my survey 255 students like T- shirts of 300 students
Alicia: As per my survey 180 T-shirts to be ordered for sale of 300 students
Question 11.
Three of the five medical doctors surveyed by a biochemist prefer his newly approved Brand X as compared to the leading medicine. The biochemist used these results to write the TV advertisement shown. Is the inference valid? Explain your answer.

Answer:
Yes, it is valid
Explanation:
60% biochemist survey results approved Brand X as compared to the leading medicine.
Question 12.
Aaron conducted a survey of the type of shoes worn by a random sample of students in his school. The results of his survey are shown at the right.
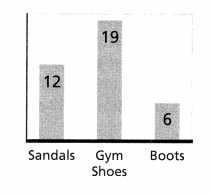
a. Make a valid inference that compares the number of students who are likely to wear gym shoes and those likely to wear boots.
b. Make a valid inference that compares the number of students who are likely to wear boots and those likely to wear sandals.
Answer:
a) number of students who are likely to wear gym shoes three times more then those likely to wear boots.
b) number of students who are likely to wear boots are two times less then those likely to wear sandals.
Question 13.
Shantel and Syrus are researching the types of novels that people read. Shantel asks every ninth person at the entrance of a mall. She infers that about 26% of the population prefers fantasy novels. Syrus asks every person in only one store. He infers that about 47% of the population prefers fantasy novels.
a. Construct Arguments Whose inference is more likely to be valid? Explain.
b. What mistake might Syrus have made?
Answer:
a) Shantel asks every ninth person at the entrance of a mall is the correct sample survey for researching the type of novels the people read, which gives 26% of the population prefers fantasy novels.
b) Syrus askes in only one store can not give good results even he infers 47% of the population prefers the fantasy navels.
Question 14.
Higher Order Thinking A national TV news show conducted an online poll to find the nation’s favorite comedian. The website showed the pictures of 5 comedians and asked visitors of the site to vote. The news show inferred that the comedian with the most votes was the funniest comedian in the nation.
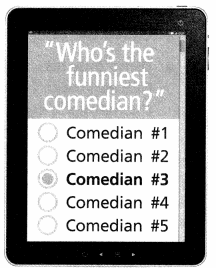
a. Is the inference valid? Explain.
b. How could you improve the poll? Explain.
Answer:
YES, its valid.
Explanation : conducting survey by a national TV news show by online poll to find the nation’s favorite comedian. the comedian #3 with the most votes was the funniest comedian in the nation.
Broadcasting the news in other channels can participate more population for more accurate results.
In 15 and 16, use the table of survey results from a random sample of people about the way they prefer to view movies.
Question 15.
Lindsay infers that out of 400 people, 300 would prefer to watch movies in a theater. Is her inference valid? Explain.
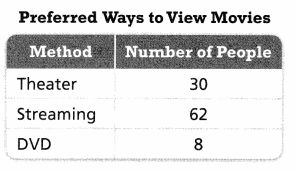
Answer:
NO, her inference is not valid.
Explanation :
As per survey results form a random sample of people preference is given to Streaming rather then Theater.
Question 16.
Which inferences are valid? Select all that apply.
![]() Going to a theater is the most popular way to watch a movie.
Going to a theater is the most popular way to watch a movie.
![]() About twice as many people would prefer to stream movies instead of watching in a theater.
About twice as many people would prefer to stream movies instead of watching in a theater.
![]() About 3 times as many people would prefer to watch a movie on DVD instead of watching in a theater.
About 3 times as many people would prefer to watch a movie on DVD instead of watching in a theater.
![]() About 8 times as many people would prefer to watch a movie on DVD instead of streaming.
About 8 times as many people would prefer to watch a movie on DVD instead of streaming.
![]() Most people would prefer streaming over any other method.
Most people would prefer streaming over any other method.
Answer:
Most people would prefer streaming over any other method
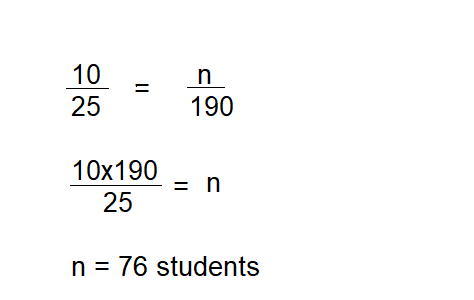
Question 17.
Monique collects data from a random sample of seventh graders in her school and finds that 10 out of 25 seventh graders participate in after-school activities. Write and solve a proportion to estimate the number of seventh graders, n, who participate in after-school activities if 190 seventh graders attend Monique’s school.
Answer:
76 students participated.
Explanation:
Question 18.
Each of the 65 participants at a basketball camp attempted 20 free throws. Mitchell collected data for the first 10 participants, most of whom were first-time campers. Lydia collected data for the next 10 participants, most of whom had attended the camp for at least one week.
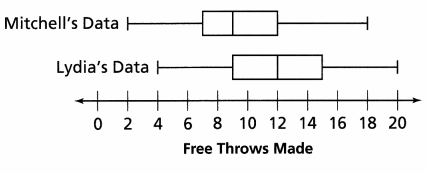
a. Using only his own data, what inference might Mitchell make about the median number of free throws made by the 65 participants?
Answer:
Median is 9 as per the Mitchell data
Explanation:
IQR remains same even more entries raise.
b. Using only her own data, what inference might Lydia make about the median number of free throws made by the 65 participants?
Answer:
Median is 12 as per the Lydia’s Data
Explanation IQR remain same
c. Who made a valid inference? Explain.
Answer:
Both Mitchell and Lydia made a valid inference.
Explanation:
Mitchell collected data of first 10 participants, most of whom were first-time campers. Lydia collected data for the next 10 participants, most of whom had attended the camp for at least one week.
Assessment Practice
Question 19.
June wants to know how many times most people have their hair cut each year. She asks two of her friends from Redville and Greenburg, respectively, to conduct a random survey. The results of the surveys are shown below.
Redville surveyed on 50 people
Median number of haircuts: 7
Mean number of haircuts: 7.3
Greenburg: 60 people surveyed
Median number of haircuts: 6.5
Mean number of haircuts: 7.6
June infers that most people get 7 haircuts per year. Based on the survey results, is this a valid inference? Explain.
Answer:
YES, its valid inference.
Explanation :
The mean and median are the averages of the survey measures or data collected and number 7 lies in between the 6.5 to 7.6 its a valid
TOPIC 6 MID-TOPIC CHECKPOINT
Question 1.
Vocabulary Krista says that her chickens lay the most eggs of any chickens in the county. To prove her claim, she could survey chicken farms to see how many eggs each of their chickens laid that day. In this scenario, what is the population and what is a possible representative sample?
Answer:
A population is an entire group of objects-people, animals, plants—from which data can be collected.
A representative sample of a population has the same characteristics as the population.
Question 2.
Marcy wants to know which type of book is most commonly checked out by visitors of her local public library. She surveys people in the children’s reading room between 1:00 and 2:00 on Saturday afternoon. Select all the statements about Marcy’s survey that are true. Lesson 6-1
![]() Marcy’s sample is not representative because not all of the library’s visitors go to the children’s reading room.
Marcy’s sample is not representative because not all of the library’s visitors go to the children’s reading room.
![]() Marcy’s sample is a representative sample of the population.
Marcy’s sample is a representative sample of the population.
![]() Marcy will get a random sample by surveying as many people in the children’s reading room as possible.
Marcy will get a random sample by surveying as many people in the children’s reading room as possible.
![]() The population of Marcy’s study consists of all visitors of the public library.
The population of Marcy’s study consists of all visitors of the public library.
![]() The results of Marcy’s survey include a mode, but neither a mean nor a median.
The results of Marcy’s survey include a mode, but neither a mean nor a median.
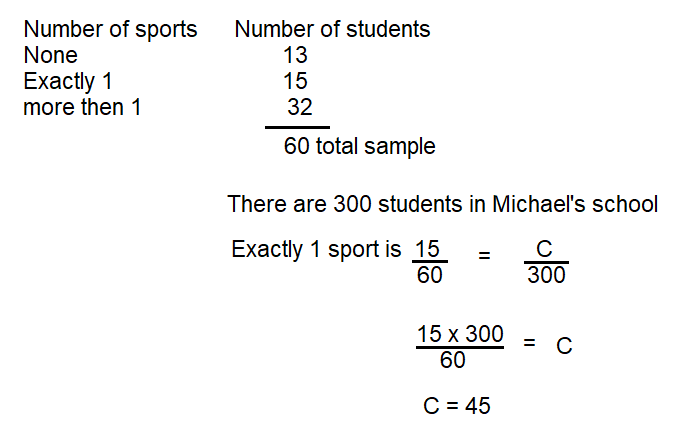
For Problems 3-5, use the data from the table.
Question 3.
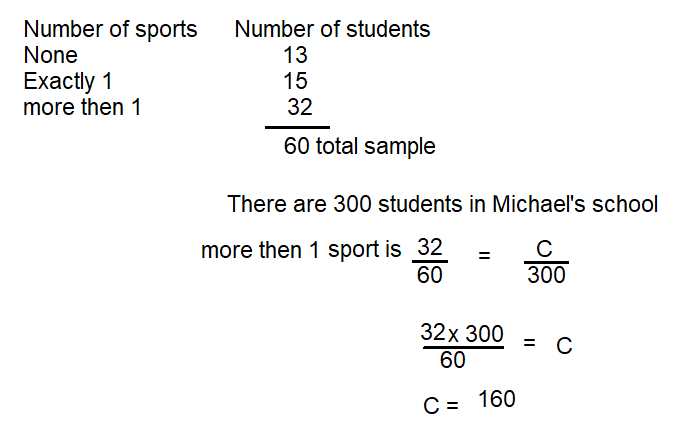
Michael surveyed a random sample of students in his school about the number of sports they play. There are 300 students in Michael’s school. Use the results of the survey to estimate the number of students in Michael’s school who play exactly one sport. Explain your answer. Lesson 6-2
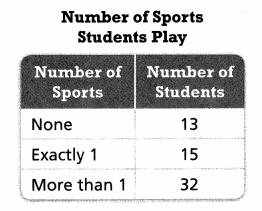
Answer:
45 students play exactly one sport
Explanation:
Question 4.
What inference can you draw about the number of students who play more than one sport? Lesson 6-2
Answer:
160 students play more then 1 sport.
Explanation:
Question 5.
Avi says that Michael’s sample was not random because he did not survey students from other schools. Is Avi’s statement correct?
Explain. Lesson 6-1
Answer:
No, Avi’s statement is not correct.
Explanation:
Michael’s survey is about his school students and their play, not about other school.
How well did you do on the mid-topic checkpoint? Fill in the stars. 

Topic 6 MID-TOPIC PERFORMANCE TASK
Sunil is the ticket manager at a local soccer field. He wants to conduct a survey to determine how many games most spectators attend during the soccer season.
PART A
What is the population for Sunil’s survey? Give an example of a way that Sunil could collect a representative sample of this population.
Answer:
The population in Sunil’s survey is 150.
He could collect the sample from ticket manager at a local Soccer field.
Explanation:
According to part B population of sunil’s survey is determined.
PART B
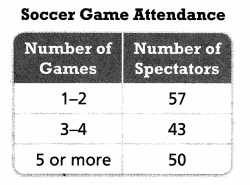
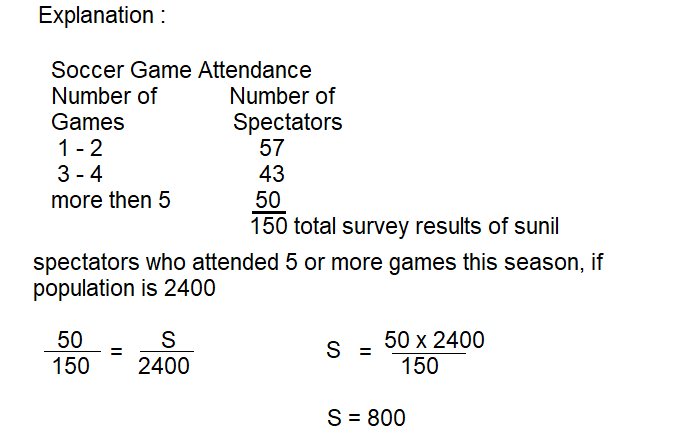
Sunil conducts the survey and obtains the results shown in the table below. What can Sunil infer from the results of the survey?
Answer:
Only 1 or 2 games be conducted.
Explanation:
From the above survey he concluded.
PART C
Suppose 2,400 spectators attend at least one game this soccer season. Use the survey data to estimate the number of spectators who attended 5 or more games this season. Explain how you made your estimate.
Answer:
The survey data to estimate the number of spectators who attended 5 or more games this season is 2,400.
Lesson 6.3 Make Comparative Inferences About Populations
Explore It!
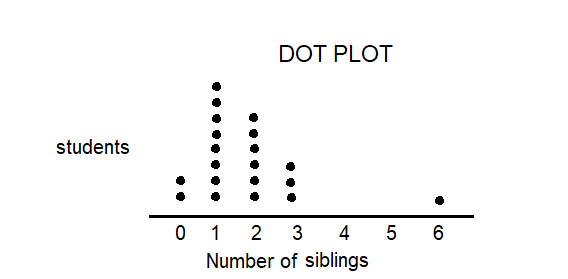
Ella surveys a random sample of 20 seventh graders about the number of siblings they have.

The table shows the results of her survey.
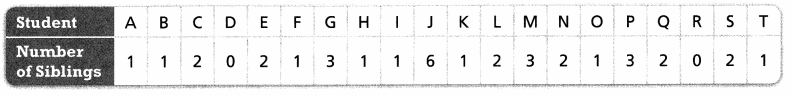
A. Model with Math Draw a model to show how Ella can best display her data.
Answer:
Explanation:
In the above data number of students siblings are displayed on DOT PLOT.
B. Explain why you chose that model.
Dot Plot is easy and effective to show the data.
Explanation:
Dot plot and Box plot are the types of math draw models, that data can be shown in chart format, here Dot plot taken as it is easy and effective way of showing data on charts,
Focus on math practices
Reasoning Using your data display, what can you infer about the number of siblings that most seventh graders have? Explain.
Answer:
Only 1 sibling.
Explanation:
As shown in the above dot plot of 7th grade students has numbers of siblings 1 are more
Essential Question
How can data displays be used to compare populations?
Answer :
Data can be displayed using Dot plot, Box plot or Histogram to compare the population for concluding valid reasons.
Try It!
Kono gathers the heights of a random sample of sixth graders and seventh graders and displays the data in box plots. What can he say about the two data sets?
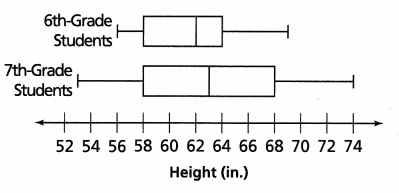
Answer:
The median of the 7th grade sample is greater than the median of the 6th grade sample.
The 7th grade sample has greater variability.
Explanation:
By comparing both the box plots, he concluded that 7th grade has greater variability. Most 7th grade students have one sibling 8 out of 20 students
Convince Me!
How can you visually compare data from two samples that are displayed in box plots?
Answer:
Guidelines for comparing boxplots from two sam
- Compare the respective medians, to compare location.
- Compare the interquartile ranges (that is, the box lengths), to compare dispersion.
- Look at the overall spread as shown by the adjacent values.
- Look for signs of skewness.
- Look for potential outliers.
Try It!
A local recreation center offers a drop-in exercise class in the morning and in the evening. The attendance data for each class over the first month is shown in the box plots at the right. What can you infer about the class attendance?
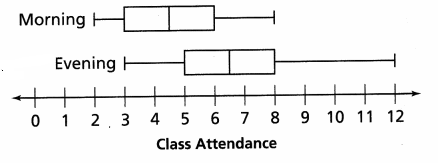
Answer:
The line for the median of evening attendance data set is to the right of the line for the median of morning attendance data set.
so, morning attendance data can say that the median of evening attendance data set is greater.
Explanation:
The box for evening attendance data set is longer then the morning data set.so, evening attendance data is more spread out or grater variability
KEY CONCEPT
You can use data displays, such as box plots, to make informal comparative inferences about two populations. You can compare the shapes of the data displays or the measures of center and variability.
Do You Understand?
Question 1.
Essential Question How can data displays be used to compare populations?
Answer:
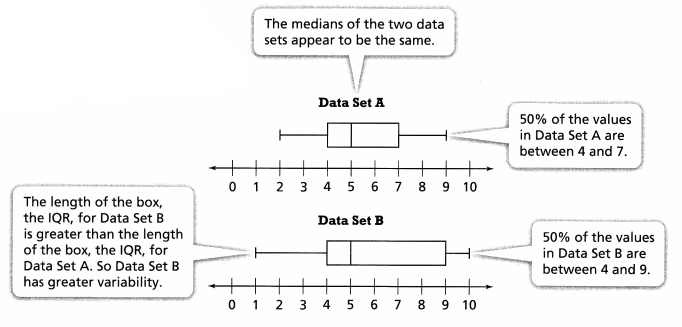
The median and variability of measures are compared between the data set A and set B
Question 2.
Generalize What measures of variability are used when comparing box plots? What do these measures tell you?
Answer:
The median and variability of measures are compared between the data set A and set B.
Explanation:
Here the median is same 5, and the data set B, variability is 9 , that is greater compared to data set A is 7.
So ,these measures tell us the greater or smaller comparison
Question 3.
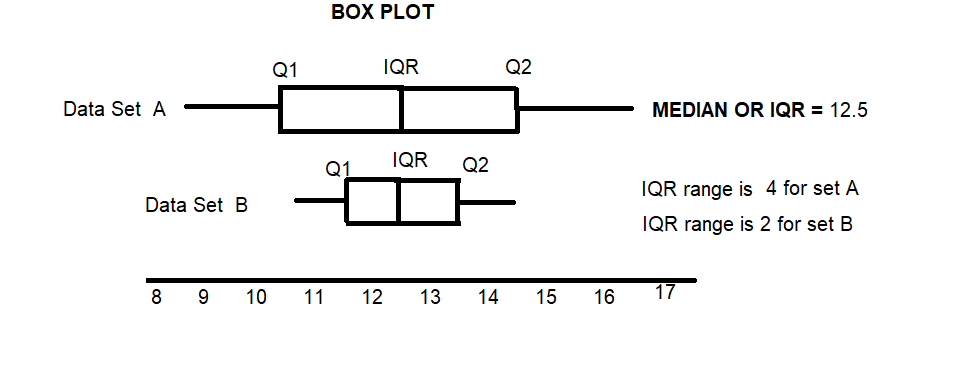
Make Sense and Persevere Two data sets both have a median value of 12.5. Data Set A has an interquartile range of 4 and Data Set B has an interquartile range of 2. How do the box plots for the two data sets compare?
Answer:
BOX PLOT
Explanation:
Do You Know How?
The box plots describe the heights of flowers selected randomly from two gardens. Use the box plots to answer 4 and 5.
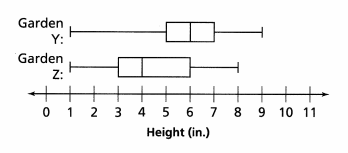
Question 4.
Find the median of each sample.
Garden Y median = ___ inches
Garden Z median = ___ inches
Answer:
Garden Y median = 6 inches
Garden Z median = 4 inches
Explanation :
In the above box plot the median or IQR is shown in the graph
Question 5.
Make a comparative inference about the flowers in the two gardens.
Answer:
Heights of the flowers in the Garden .
Y is greater then the Garden Z as the median of the Garden Y flowers is right to the Garden Z flowers.
Garden Y is more spread out or grater variability compare to the Garden Z.
Explanation:
Compare the gardens of Y and Z, displayed in the box plot.
Practice & Problem Solving
Leveled Practice For 6-8, complete each statement.
Question 6.
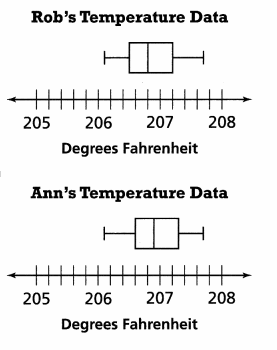
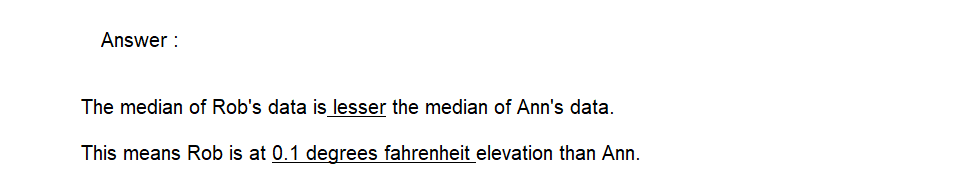
Water boils at lower temperatures as elevation increases. Rob and Ann live in different cities. They both boil the same amount of water in the same size pan and repeat the experiment the same number of times. Each records the water temperature just as the water starts to boil. They use box plots to display their data. Compare the medians of the box plots.
The median of Rob’s data is  the median of Ann’s data.
This means Rob is at elevation than Ann.
Explanation:
Question 7.
Liz is analyzing two data sets that compare the amount of food two animals eat each day for one month.
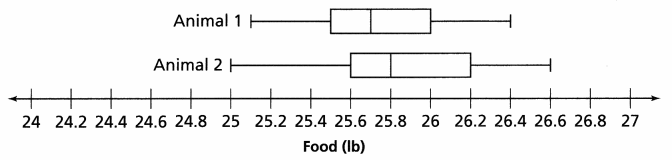
a. The median of Animal 2’s data is 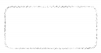 than the median of Animal 1’s data
b. Liz can infer that there is variability in the data for Animal 1 than for Animal 2.
c. Liz can infer that Animal generally eats more food.
Answer:
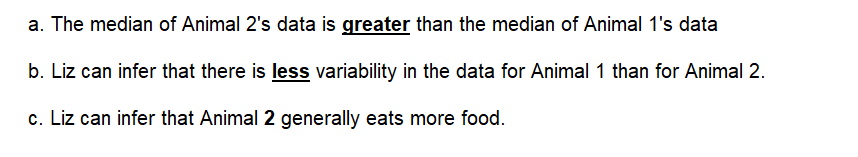
Question 8.
The box plots show the heights of a sample of two types of trees.
The median height of Tree ![]() is greater.
is greater.
Answer:
Tree 1 height is greater then Tree 2.
Explanation:
The median of the Tree 1 is right side of the Tree 2 median,
So the Height of the Tree 1 is greater.
Question 9.
Reasoning A family is comparing home prices in towns where they would like to live. The family learns that the median home price in Hometown is equal to the median home price in Plainfield and concludes that the homes in Hometown and Plainfield are similarly priced.
What is another statistical measure that the family might consider when deciding where to purchase a home?
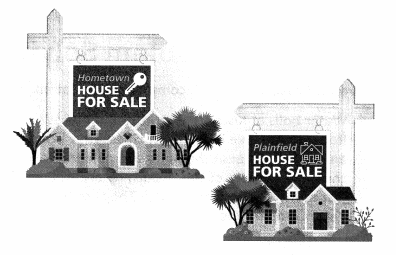
Answer:
If median is same, then Mean can be a another statistical measure to check for the best option, and variability of the space of the house plot can be compared for the greater one in space.
Explanation:
Mean and median both try to measure the “central tendency” in a data set. The goal of each is to get an idea of a “typical” value in the data set. The mean is commonly used, but sometimes the median is preferred.
Question 10.
Higher Order Thinking The box plots show the daily average high temperatures of two cities from January to December. Which city should you live in if you want a greater variability in temperature? Explain.
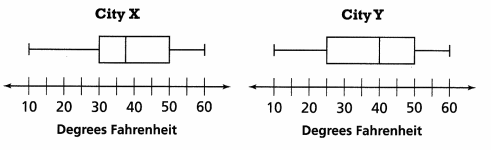
Answer:
City X has greater variability.
Explanation :
City X and Y are of same temperature variability, but the median of City X is less then the City Y.
Assessment Practice
Question 11.
Paul compares the high temperatures in City 1 and City 2 for one week. In City 1, the range in temperature is 10°F and the IQR is 5°F. In City 2, the range in temperature is 20°F and the IQR is 5°F. What might you conclude about the weather pattern in each city based on the ranges and interquartile ranges?
A. The weather pattern in City 1 is more consistent than the weather pattern in City 2.
B. The weather patterns in City 1 and City 2 are equally consistent.
C. The weather pattern in City 2 is more consistent than the weather pattern in City 1.
D. The range and interquartile range do not provide enough information to make a conclusion.
Answer:
Option A
Explanation:
The IQR of both the Cities are same (IQR is 5°F) but the rage in temperature city 1 has less then the city 2.
Lesson 6.4 Make More Comparative Inferences About Populations
Explore It!
Jackson and his brother Levi watch Jewel Geyser erupt one afternoon. They record the time intervals between eruptions. The dot plot shows their data.
Jackson estimates that the average time between eruptions is 8 minutes. Levi estimates that the average time between eruptions is 8\(\frac{1}{2}\) minutes.
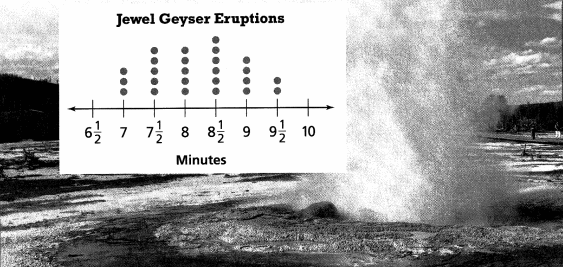
A. Construct Arguments Construct an argument to support Jackson’s position.
Jackson estimates the average time between eruptions is 8 minutes.
Levi estimates the average time between eruptions is 8\(\frac{1}{2}\) minutes. Jackson estimate is nearer to the median value of the time as shown in the above dot plot
B. Construct Arguments Construct an argument to support Levi’s position.
Jackson estimates the average time between eruptions is 8 minutes. Levi estimates the average time between eruptions is 8\(\frac{1}{2}\) minutes. Levi’s estimate is exactly value of the time as shown in the above dot plot
Focus on math practices
Reasoning How can you determine the best measure of center to describe a set of data?
Answer:
we can determine the best measure of center to describe a set of data is by finding the Mean and Median of data.
Explanation:
The mean (average) of a data set is found by adding all numbers in the data set and then dividing by the number of values in the set.
The median is the middle value when a data set is ordered from least to greatest. The mode is the number that occurs most often in a data set.
Essential Question
How can dot plots and statistical measures be used to compare populations?
Answer:
By calculating the Mean and Median of data and variability and range.
Explanation:
The mean (average) of a data set is found by adding all numbers in the data set and then dividing by the number of values in the set.
The median is the middle value when a data set is ordered from least to greatest. The mode is the number that occurs most often in a data set.
Variability is also referred to as spread, scatter or dispersion.
Range: the difference between the highest and lowest values.
Try It!
Quinn also collects data about push-ups. Does it appear that students generally did more push-ups last year or this year? Explain your reasoning.
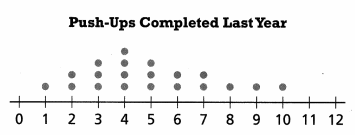
Answer:
No, it does not give any inference.
Explanation:
The students do less push-ups last year then this year.
Convince Me!
How does the range of these data sets affect the shape of the dot plots?
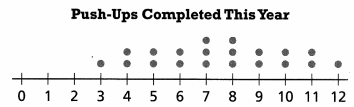
Answer:
In a dot plot, range is the difference between the values represented by the farthest. left and farthest right dots.
Explanation :
Range is 12 – 3 = 9
Try It!
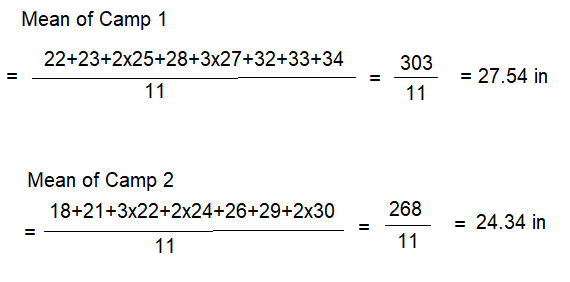
Peter surveyed a random sample of adults and a random sample of teenagers about the number of hours that they exercise in a typical week. He recorded the data in the table below. What comparative inference can Peter make from the data sets?
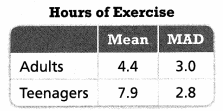
Answer:
The mean is 4.4 of adults is less then the Teenagers 7.9 the average the number of hours that they exercise in a typical week is more for teenagers.
Explanation:
Drawing comparative inferences may involve analyzing the data using mean, median, mean absolute deviation, interquartile range, range, and/or mode. In this lesson students will analyze data in different forms and draw informal comparative inferences about the populations involved.
KEY CONCEPT
You can use dot plots to make informal comparative inferences about two populations. You can compare the shapes of the data displays or the measures of center and variability.
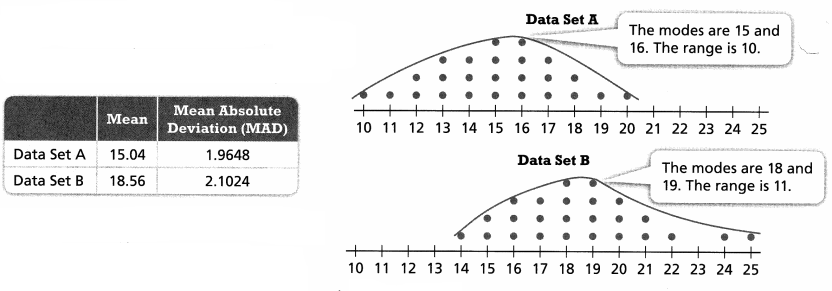
The modes of Data Set B are greater than the modes of Data Set A.
The mean of Data Set B is greater than the mean of Data Set A.
You can infer that data points are generally greater in Data Set B.
The ranges and the MADs of the data sets are similar. You can infer that the variabilities of the two data sets are about the same.
Do You Understand?
Question 1.
Essential Question How can dot plots and statistical measures be used to compare populations?
Answer:
The statistical measures of the data of set A and B are compared with reference to the Median, Mode of the sets and the variability of the measures are compared for the population.
Question 2.
Reasoning How can you make predictions using data from samples from two populations?
Answer:
we call this making predictions using random sampling from two population. We basically take data from a random sample of two population and make predictions about the whole population based on that data. Random sample – A sample of a population that is random and the every elements of the population is equally likely to be chosen for the sample.
Question 3.
Construct Arguments Two data sets have the same mean but one set has a much larger MAD than the other. Explain why you may want to use the median to compare the data sets rather than the mean.
Answer:
Both set A and B have the same mean.
Do You Know How?
For 4 and 5, use the information below.
Coach Fiske recorded the number of shots on goal his first-line hockey players made during two weeks of hockey scrimmage.
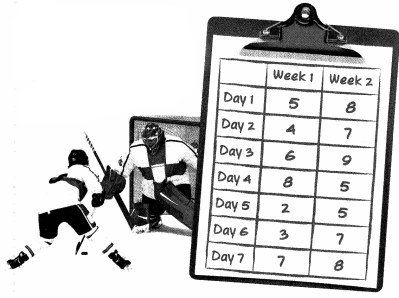
Question 4.
Find the mean number of shots on goal for each week.
Answer:
Mean of week 1 is 5 and week 2 is 7
Explanation:
Mean in week 1 is 5
(5+4+6+8+2+3+7)/5=35/7=5
Mean in week 2 is 7
(8+7+9+5+5+7+8)/7=49/7=7
Question 5.
a. Based on the mean for each week, in which week did his first line take more shots on goal?
b. Based on the comparison of the mean and the range for Week 1 and Week 2, what could the coach infer?
Answer:
a. week 2
b. the range in week 1 is more then the week 2 and the mean in week 1 is less then the week 2,
week 2 is better then the week 1 as Coach Fiske recorded the number of shots on goals made during two weeks of hockey.
Practice & Problem Solving
Question 6.
A study is done to compare the fuel efficiency of cars. Cars in Group 1 generally get about 23 miles per gallon. Cars in Group 2 generally get about 44 miles per gallon. Compare the groups by their means. Then make an inference and give a reason the inference might be true.
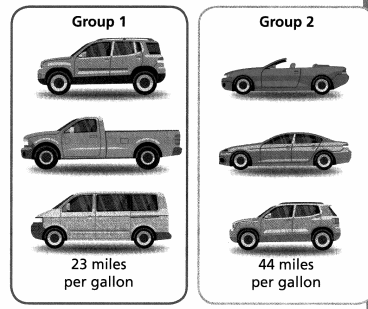
The mean for Group ![]() is less than the mean for Group
is less than the mean for Group ![]() .
.
The cars in Group ![]() generally are more fuel-efficient.
generally are more fuel-efficient.
The cars in Group ![]() may be smaller.
may be smaller.
Answer:

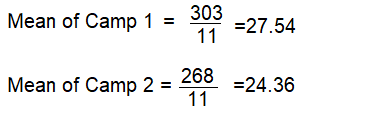
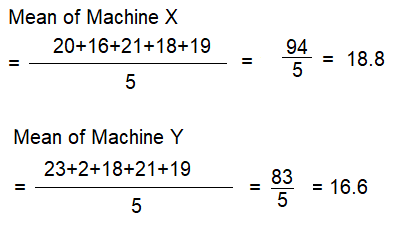
Question 7.
The dot plot shows a random sample of vertical leap heights of basketball players in two different basketball camps. Compare the mean values of the dot plots. Round to the nearest tenth.
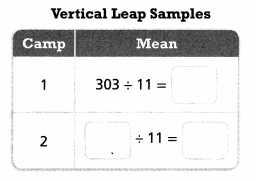
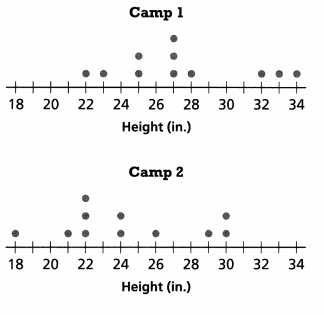
The mean values tell you that participants in Camp jump higher in general.
Answer:
camp 1 mean = 28 in
camp 2 mean = 24 in
Explanation:
Question 8.
A researcher divides some marbles into two data sets. In Data Set 1, the mean mass of the marbles is 13.6 grams. In Data Set 2, the mean mass of the marbles is 14 grams. The MAD of both data sets is 2. What can you infer about the two sets of marbles?
Answer:
The mass of marbles in set 2 is higher then the marbles in set 1 as comparing the mean mass of the marbles of both sets.
Question 9.
Generalize Brianna asks 8 classmates how many pencils and erasers they carry in their bags. The mean number of pencils is 11. The mean number of erasers is 4. The MAD of both data sets is 2. What inference could Brianna make using this data?
Answer:
Total 88 pencils and 32 erasers they carry in their bags.
Explanation:
Pencils =(P)/8 = 11
P= 11×8=88
Erasers = (E)/8=4
E=8×4 = 32
Question 10.
Higher Order Thinking Two machines in a factory are supposed to work at the same speed to pass inspection. The number of items built by each machine on five different days is recorded in the table. The inspector believes that the machines should not pass inspection because the mean speed of Machine X is much faster than the mean speed of Machine Y.
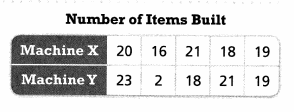
a. Which measures of center and variability should be used to compare the performances of each machine? Explain.
b. Is the inspector correct? Explain.
Answer:
a. Median and IQR are used.
Explanation:
b. YES, the inspector is correct.
Explanation:
The mean speed of Machine X is faster then the Machine Y, they should run same speed but they are varying with an average speed of 2.2.
Assessment Practice
Question 11.
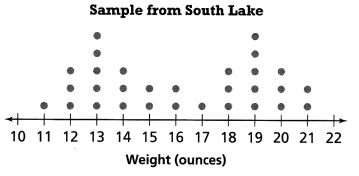
The dot plots show the weights of a random sample of fish from two lakes. Which comparative inference about the fish in the two lakes is most likely correct?
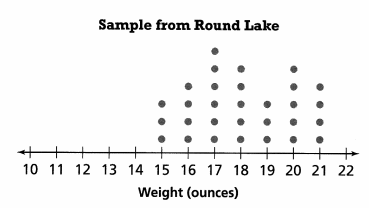
A. There is about the same variation in weight between small and large fish in both lakes.
Answer:
No, there is variation.
Explanation:
Variation of weights in Round Lake is from 15 to 21 ounces, difference is 6 ounce. In South lake weights vary from 11 to 21 ounces, difference is 10 ounce
B. There is less variation in weight between small and large fish in South Lake than between small and large fish in Round Lake.
Answer:
No, there is variation.
Explanation:
Variation in south lake is higher then the Round lake, they differ with 10 ounce and 6 ounce respectively.
C. There is less variation in weight between small and large fish in Round Lake than between small and large fish in South Lake.
Answer:
YES, 6 ounce in Round lake.
Explanation:
Variation in south lake is higher then the Round lake, they differ with 10 ounce and 6 ounce respectively
D. There is greater variability in the weights of fish in Round Lake.
Answer:
No, there is variation.
Explanation:
Less variability in the weights of the fish in the round lake.
3-Act Mathematical Modeling: Raising Money
ACT 1
Question 1.
After watching the video, what is the first question that comes to mind?
Answer:
Question 2.
Write the Main Question you will answer.
Answer:
Question 3.
Make a prediction to answer this Main Question.
Answer:
Question 4.
Construct Arguments Explain how you arrived at your prediction.

Answer:
ACT 2
Question 5.
What information in this situation would be helpful to know? How would you use that information?
Answer:
Question 6.
Use Appropriate Tools What tools can you use to solve the problem? Explain how you would use them strategically.
Answer:
Question 7.
Model with Math Represent the situation using mathematics. Use your representation to answer the Main Question.
Answer:
Question 8.
What is your answer to the Main Question? Does it differ from your prediction? Explain.

Answer:
ACT 3
Question 9.
Write the answer you saw in the video.
Answer:
Question 10.
Reasoning Does your answer match the answer in the video? If not, what are some reasons that would explain the difference?

Answer:
Question 11.
Make Sense and Persevere Would you change your model now that you know the answer? Explain.
Answer:
ACT 3
Extension
Reflect
Question 12.
Model with Math Explain how you used a mathematical model to represent the situation. How did the model help you answer the Main Question?
Answer:
Question 13.
Critique Reasoning Explain why you agree or disagree with each of the arguments in Act 2.
SEQUEL
Question 14.
Use Appropriate Tools You and your friends are starting a new school club. Design a sampling method that is easy to use to help you estimate how many people will join your club. What tools will you use?

Answer:
TOPIC 6 REVIEW
Topic Essential Question
How can sampling be used to draw inferences about one or more populations?
Vocabulary Review
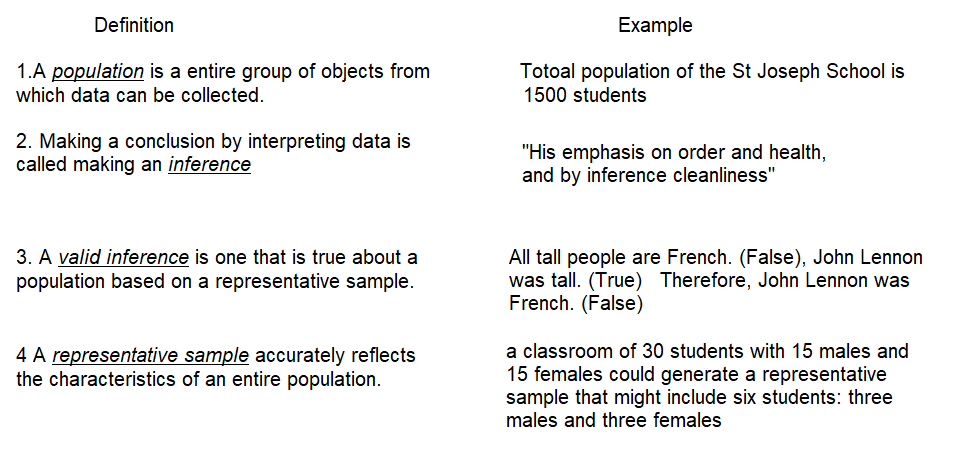
Complete each definition, and then provide an example of each vocabulary word used.
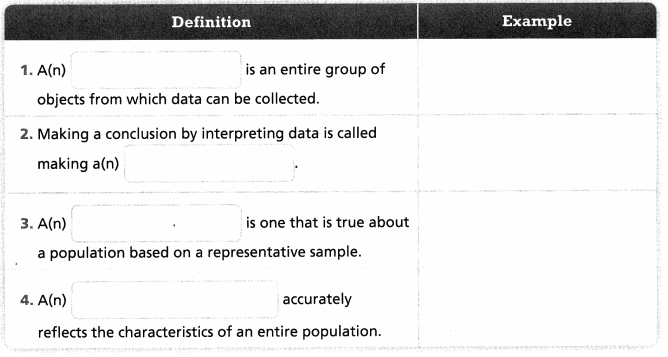
- A population is a entire group of objects from which data can be collected.
2. Making a conclusion by interpreting data is called making an inference
3. A valid inference is one that is true about a population based on a representative sample.
4 A(n) representative sample accurately reflects the characteristics of an entire population.
Use Vocabulary in Writing
Do adults or teenagers brush their teeth more? Nelson surveys two groups: 50 seventh grade students from his school and 50 students at a nearby college of dentistry. Use vocabulary words to explain whether Nelson can draw valid conclusions.
Concepts and Skills Review
LESSON 6-1 Populations and Samples
Quick Review
A population is an entire group of people, items, or events. Most populations must be reduced to a smaller group, or sample, before surveying. A representative sample accurately reflects the characteristics of the population. In a random sample, each member of the population has an equal chance of being included.
Practice
Question 1.
Anthony opened a new store and wants to conduct a survey to determine the best store hours. Which is the best representative sample?
A. A group of randomly selected people who come to the store in one week
B. A group of randomly selected people who visit his website on one night
C. Every person he meets at his health club one night
D. The first 20 people who walk into his store one day
Answer:
Option A
Question 2.
Becky wants to know if she should sell cranberry muffins at her bakery. She asks every customer who buys blueberry muffins if they would buy cranberry muffins. Is this a representative sample? Explain.
Answer:
A representative sample accurately reflects the characteristics of the population. Those like blueberry muffins may not like cranberry muffins
up to their choice.
Question 3.
Simon wants to find out which shop has the best frozen fruit drink in town. How could Simon conduct a survey with a sample that is representative of the population?
Answer:
A representative sample accurately reflects the characteristics of the population. that means Simon select some representative samples of his friends as a random sample, to find out shop has the best frozen fruit drink in town.
LESSON 6-2 Draw Inferences from Data
Quick Review
An inference is a conclusion about a population based on data from a sample or samples. Patterns or trends in data from representative samples can be used to make valid inferences. Estimates can be made about the population based on the sample data.
Practice
Question 1.
Refer to the example. Polly surveys two more samples. Do the results from these samples support the inference made from the example?
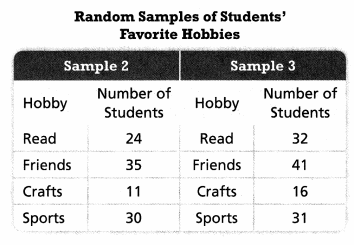
Answer:
In all three samples Polly collected there is the least number of students that do crafts for a hobby
that means that Polly made the correct inference
LESSONS 6-3 AND 6-4
Make Comparative Inferences About Populations | Make More Comparative Inferences About Populations
Quick Review
Box plots and dot plots are common ways to display data gathered from samples of populations. Using these data displays makes it easier to visually compare sets of data and make inferences. Statistical measures such as mean, median, mode, MAD, interquartile range (IQR), and range can also be used to draw inferences when comparing data from samples of two populations.
Practice
Question 1.
The two data sets show the number of days that team members trained before a 5K race.
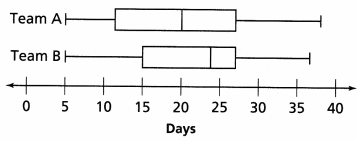
a. What inference can you draw by comparing the medians?
Answer :
Team B median is higher then the A median, The range of Team A is higher then the Team B of the number of days that team members trained before a 5K race
b. What inference can you draw by comparing the interquartile ranges?
Answer:
Team B IQR is right side of the Team A IQR in the above box plot of days that team members trained before a 5K race
IQR of Team A is 20 and IQR of Team B is 24
Question 2.
The dot plots show how long it took students in Mr. Chauncey’s two science classes to finish their science homework last night. Find the means to make an inference about the data.
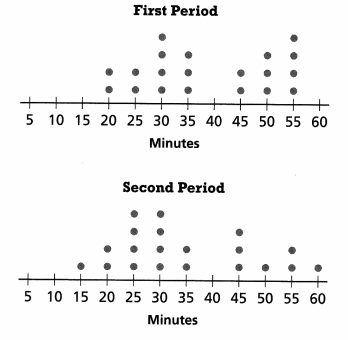
Answer:
i) mean of first period is 38.75 Minutes
ii) mean of second period is 35 Minutes
Explanation:
Mean of first period=(20×2+25×2+30×4+35×3+45×2+50×3+55×4)/20=775/20=38.75
Mean of Second Period=(15×1+20×2+25×4+30×4+35×2+45×3+50×1+55×2+60×1)/20=700/20=35
Second period home work taken less time then first period science home work
TOPIC 6 Fluency Practice
Riddle Rearranging
Find each percent change or percent error. Round to the nearest whole percent as needed. Then arrange the answers in order from least to greatest. The letters will spell out the answer to the riddle below.
V
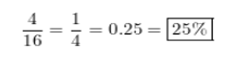
A young tree is 16 inches tall. One year later, it is 20 inches tall. What is the percent increase in height?
Answer : 25%
Explanation:
The Tree grew for 4 inches, we need to find the % of the starting height that equals
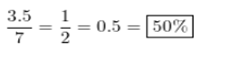
A
A ship weighs 7 tons with no cargo. With cargo, it weighs 10.5 tons. What is the percent increase in the weight?
Answer: 50%
Explanation:
The ship’s weight changed for 3.5 tons.
Divide 3.5 by the weight of the ship with no cargo to calculate the percentage increase in the ships weight.
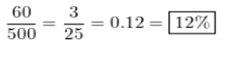
R
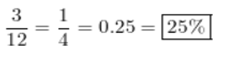
The balance of an account is $500 in April. In May it is $440. What is the percent decrease in the balance?
Answer: 12%
Explanation:
The change in the balance 60 out of 500.
divide the two values to calculate the percent decrease in the balance.
B
Ben thought an assignment would take 20 minutes to complete. It took 35 minutes. What is the percent error in his estimate of the time?
Answer : 42.86%
Explanation:
Divide the absolute value of the error (15) by the actual time it took to him to complete the assignment (35).
N
Natalie has $250 in savings. At the end of 6 months, she has $450 in savings. What is the percent increase in the amount of her savings?
Answer: 80%
Explanation:
The absolute increase of the money in Natalie’s bank account is $200 and we know that she started the period with $250 in her account.
Divide the two values to calculate the percent increase of the money in her account.
I
The water level of a lake is 22 feet. It falls to 18 feet during one month. What is the percent decrease in the water level?
Answer: 18%
Explanation :
The water lowered for 4 feet in the fall .
Divide that by the water level before the decrease the to calculate the percent decrease of the water level.
R
Shamar has 215 photos on his cell phone. He deletes some so that only 129 photos remain. What is the percent decrease in the number of photos?
Answer : 40%
Explanation:
Divide the number of pictures Shamar deleted(215-129=86) by the number of pictures Shamar had on his phone before he started deleting them(215).
K
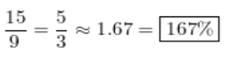
Lita estimates she will read 24 books during the summer. She actually reads 9 books. What is the percent error of her estimate?
Answer: 167%
Explanation:
Divide the value of the absolute error.
Lita made(24-9=15) by the actual number of books she red (9), to calculate the percent error she made.
E
Camden estimates his backpack weighs 9 pounds with his books. It actually weighs 12 pounds. What is the percent error of his estimate?
Answer: 25%
Explanation:
The absolute error Camden made is 3
Divide that by the actual weight of the backpack(12) to calculate the percent error Camden made.
Answer: RIVER BANK
Explanation :
Arrange the values from smallest to largest
12<18<25=25<40<42.86<50<80<167
The letters put together give the solution to the Riddle.