Go through the enVision Math Common Core Grade 7 Answer Key Topic 7 Probability and finish your homework or assignments.
enVision Math Common Core 7th Grade Answers Key Topic 7 Probability
GET READY!
Review What You Know!
Vocabulary
Choose the best term from the box to complete each definition.
Question 1.
A(n) _________ is a drawing that can be used to visually represent information.
Answer:
A(n) diagram is a drawing that can be used to visually represent information.
Explanation:
In the above-given question,
given that,
A(n) diagram is a drawing that can be used to visually represent information.
for example:
a diagram is a visual representation of information.
diagrams can be both two-dimensional and three-dimensional.
some of the most common types of diagrams are flowcharts.
Question 2.
The number of times a specific value occurs is referred to as _________.
Answer:
The number of times a specific value occurs is referred to as frequency.
Explanation:
In the above-given question,
given that,
the number of times a specific value occurs is referred to as frequency.
for example:
3, 3, 5, 5, 5, 6, 7, 7, 7, 7, and 7.
from the above data set – 3 occurs 2 times, then 2 is the frequency of 3.
5 occurs 3 times, then 3 is the frequency of 5.
6 occurs 1 time, then 1 is the frequency of 6.
Question 3.
A(n) _________ is a relationship between one quantity and another quantity.
Answer:
A(n) ratio is a relationship between one quantity and another quantity.
Explanation:
In the above-given question,
given that,
A(n) ratio is a relationship between one quantity and another quantity.
for example:
there are 3 boys and 6 girls in a class.
therefore the ratio is 1: 2.
Question 4.
Quantities that have the same value are
Answer:
Quantities that have the same value are equivalent ratios.
Explanation:
In the above-given question,
given that,
Quantities that have the same value are equivalent ratios.
for example:
the cost of the order is 8.
pizzas ordered is 1.
8/1 = 16/2 = 24/3 = 32/4 = 40/5 = 8.
so $8 per pizza.
Operations with Fractions
Solve for x.
Question 5.
\(\frac{2}{5}\) + x = 1
Answer:
2/5 + x = 1 is 0.6.
Explanation:
In the above-given question,
given that,
\(\frac{2}{5}\) + x = 1.
2/5 + x = 1.
0.4 + x = 1.
x = 1 – 0.4.
x = 0.6.
so the value of x is 0.6.
Question 6.
225 • \(\frac{1}{3}\)= x
Answer:
225 (1/3) = x is 75.
Explanation:
In the above-given question,
given that,
225 • \(\frac{1}{3}\)= x
225(1/3) = x.
75 = x.
so the value of x is 75.
Question 7.
1 = \(\frac{1}{8}\) + x + \(\frac{2}{8}\)
Answer:
1 = 1/8 + x + 2/8 is 0.625.
Explanation:
In the above-given question,
given that,
1 = \(\frac{1}{8}\) + x + \(\frac{2}{8}\).
1 = 0.125 + x + 0.25.
1 – 0.125 = x + 0.25.
0.875 – 0.25 = x.
x = 0.625.
so the value of x is 0.625.
Ratios
Write each ratio in fraction form. Then write the percent equivalent.
Question 8.
72 out of 96
Answer:
72/96 = 0.75.
Explanation:
In the above-given question,
given that,
72 out of 96.
72/96.
0.75.
Question 9.
88 out of 132
Answer:
88/132 = 0.66.
Explanation:
In the above-given question,
given that,
88 out of 132.
88/132.
0.66.
Question 10.
39 out of 104
Answer:
39/104 = 0.375.
Explanation:
In the above-given question,
given that,
39 out of 104.
39/104.
0.375.
Question 11.
23 out of 69
Answer:
23/69 = 0.33.
Explanation:
In the above-given question,
given that,
23 out of 69.
23/69.
0.33.
Question 12.
52 out of 208
Answer:
52/208 = 0.25.
Explanation:
In the above-given question,
given that,
52 out of 208.
52/208.
0.25.
Question 13.
25 out of 200
Answer:
25/200 = 0.125.
Explanation:
In the above-given question,
given that,
25 out of 200.
25/200.
0.125.
Order Fractions and Decimals
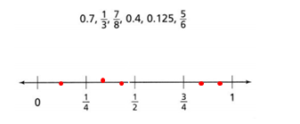
Plot the following fractions and decimals on the number line.
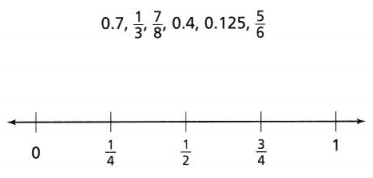
Answer:
The fractions and decimals are 0.7, 1/3, 7/8, 0.4, 0.125, and 5/6.
Explanation:
In the above-given question,
given that,
the fractions and decimals are 0.7, 1/3, 7/8, 0.4, 0.125, and 5/6.
1/3 = 0.3.
7/8 = 0.875.
5/6 = 0.83.
1/4 = 0.25.
1/2 = 0.5.
3/4 = 0.75.
0.7 lies in between 3/4 and 1.
0.3 lies in between 1/4 and 1/2.
7/8 lies in between 3/4 and 1.
0.4 lies in between 1/4 and 1/2.
5/6 lies in between 3/4 and 1.
0.125 lies in between 0 and 1/4.
Language Development
Sort the vocabulary words into categories. Explain your categories.
Category: Probability.
Explanation:
In the above-given question,
given that,
probability of a given event is an expression of the likelihood of occurrence of an event.
a probability is a number that ranges from 0 to 1.
there are so many types of probabilities are there.
they are theoretical probability and experimental probability.
for example:
0 for an event that cannot occur.
1 for an event that can occur.
Category: Event.
Explanation:
In the above-given question,
given that,
an event is a subject of the sample space.
that is any collection of outcomes from an event.
events will be denoted b capital letters.
Category: Frequency.
Explanation:
In the above-given question,
given that,
frequency is the rate at which something occurs over a particular period of time or in a given sample.
sample space and relative frequency come under this.
for example:
3, 3, 5, 5, 5, 6, 7, 7, 7, 7, and 7.
from the above data set – 3 occurs 2 times, then 2 is the frequency of 3.
5 occurs 3 times, then 3 is the frequency of 5.
6 occurs 1 time, then 1 is the frequency of 6.
Category: Simulation.
Pick A Project
PROJECT 7A
What makes a carnival game fun and successful?
PROJECT: DEVELOP A GAME OF CHANCE
PROJECT 7B
If you could invent a character for an adventure, what would that character be like?
Project: Design An Adventure
PROJECT 7C
What is the silliest sentence you can think of? Why is it silly?
Project: Generate A Funny Sentence
PROJECT 7D
How could you teach a math concept through a performance?
Project: Perform Your Knowledge
Lesson 7.1 Understand Likelihood and Probability
Solve & Discuss It!
For a game show, Jared has to choose 1 of 8 boxes to win a prize. One of the boxes has a big prize, 3 boxes have a medium prize, 3 boxes have smaller prizes, and 1 box is empty. How confident should Jared be that whatever box he chooses, he will win a prize? Support your response with a mathematical argument.
I can… describe the likelihood that an event will occur.
Make Sense and Persevere
What are the chances that Jared will choose a box with a prize?
Answer:
The three chances are 3/8, 1/8, and 3/8.
Explanation:
In the above-given question,
given that,
Jared has to choose 1 of 8 boxes to win a prize.
One of the boxes has a big prize, 3 boxes have a medium prize, 3 boxes have smaller prizes, and 1 box is empty.
1 out of 8 boxes is 1/8.
3 out of 8 is 3/8 medium prize.
3/8 smaller prize.
1 box is empty is 1/8.
there are 3 chances.
they are 3/8, 1/8, and 3/8.
Focus on math practices
Construct Arguments Suppose the empty box is taken out of the game.
How confident should Jared be that he will win a prize? Explain.
Essential Question what is probability?
Try It!
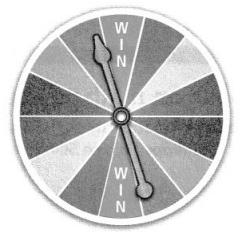
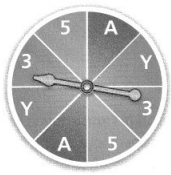
How might the probability of the pointer landing on a given color change for the spinner shown at the right?
Convince Me! How would the probability of the pointer landing on a given color change if the spinner had six equal-sized sections with each section a different color?
Try It!
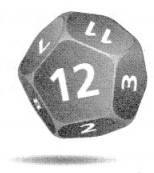
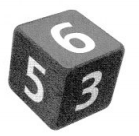
The game piece shown has 12 sides, labeled 1 to 12.
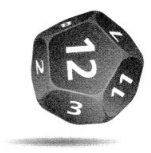
a. What is the probability of rolling an 11?
Answer:
The probability of rolling an 11 is 11/12.
Explanation:
In the above-given question,
given that,
The game piece shown has 12 sides, labeled 1 to 12.
the probability of rolling an 11 is 11/12.
so the event is on 11/12.
b. What is the probability of rolling a number greater than 5?
Answer:
The probability of rolling a number greater than 5 is 7/12.
Explanation:
In the above-given question,
given that,
The game piece shown has 12 sides, labeled 1 to 12.
the probability of rolling a number greater than 5 in 12 – 7.
12 – 7 = 5.
so the probability of rolling a number greater than 5 is 7/12.
c. What is the probability of rolling a number greater than 12?
Answer:
The probability of rolling a number greater than 12 is 1.
Explanation:
In the above-given question,
given that,
The game piece shown has 12 sides, labeled 1 to 12.
12/12 = 1.
so the probability of rolling a number greater than 12 is 1.
Try It!
Is the spinner shown a fair spinner? If yes, explain why. If not, describe a change that could make the spinner fair.

Answer:
Yes, the spinner is not a fair spinner.
Explanation:
In the above-given question,
given that,
the fair spinner is on the 12 hands.
12/6 = 2.
so the spinner is not a fair spinner.
KEY CONCEPT
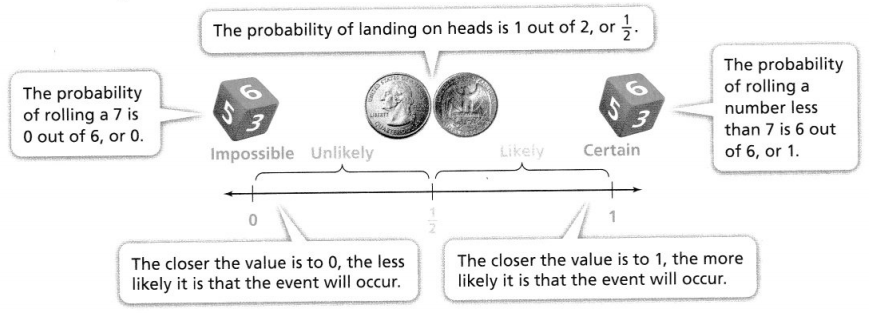
The probability that something will occur is a value from 0 to 1, which describes its likelihood. You can write probability as a ratio, such as 1 out of 2, or 3, or as a percent, such as 50%.
Do You Understand?
Question 1.
Essential Question What is probability?
Answer:
The probability of a given event is an expression of the likelihood of occurrence of an event.
Explanation:
In the above-given question,
given that,
probability of a given event is an expression of the likelihood of occurrence of an event.
a probability is a number that ranges from 0 to 1.
there are so many types of probabilities are there.
they are theoretical probability and experimental probability.
for example:
0 for an event that cannot occur.
1 for an event that can occur.
Question 2.
Construct Arguments How can you use probability to draw conclusions about the likelihood that something will occur?
Answer:
0 for an event that cannot occur.
1 for an event that can occur.
Explanation:
In the above-given question,
given that,
probability of a given event is an expression of the likelihood of occurrence of an event.
a probability is a number that ranges from 0 to 1.
there are so many types of probabilities are there.
they are theoretical probability and experimental probability.
for example:
0 for an event that cannot occur.
1 for an event that can occur.
Question 3.
Reasoning Why is probability limited to numbers between 0 and 1?
Answer:
The probability limited to numbers between 0 and 1 is 0.
Explanation:
In the above-given question,
given that,
probability of a given event is an expression of the likelihood of occurrence of an event.
a probability is a number that ranges from 0 to 1.
there are so many types of probabilities are there.
they are theoretical probability and experimental probability.
for example:
0 for an event that cannot occur.
1 for an event that can occur.
Do You Know How?
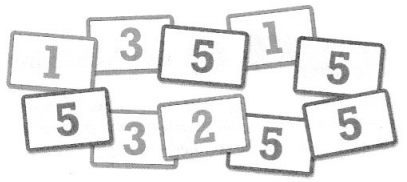
Allie is going to select a card from the group of cards shown. Complete each statement.
Question 4.
The probability that Allie will select a card labeled 3 is _________ out of 10, or _________%.
Answer:
The probability that Allie will select a card labeled 3 is 2 out of 10, or 0.002.
Explanation:
In the above-given question,
given that,
Allie is going to select a card from the group of cards shown.
3 is 2 out of 10.
3 is 2/10.
3 is 1/5 = 0.2.
Question 5.
Because the probability that each number will be selected is not _________, the group of cards is not fair.
Answer:
Because the probability that each number will be selected is not fair, the group of cards is not fair.
Explanation:
In the above-given question,
given that,
Allie is going to select a card from the group of cards shown.
5 out of 10 is 5/10 = 1/2.
so the probability that each number will be selected is not fair.
Question 6.
It is _________ that Allie will select a card labeled with a number less than 6.
Answer:
5/10 = 1/2.
Explanation:
In the above-given question,
given that,
Allie is going to select a card from the group of cards shown.
It is 5 that Allie will select a card labeled with a number less than 6.
5/10 = 1/2.
Question 7.
It is _________ that Allie will select a card labeled 4.
Answer:
It is 4/10 that Allie will select a card labeled 4.
Explanation:
In the above-given question,
given that,
Allie is going to select a card from the group of cards shown
it is 4/10 that Allie will select a card labeled 4.
4/10 = 2/5.
2/5 = 0.4.
Practice & Problem Solving
Leveled Practice In 8-10, fill in the boxes to complete each statement.
Question 8.
A spinner has 8 equal-sized sections. Six of the sections are green.
Answer:
6 out of 8 sections are green.
Explanation:
In the above-given question,
given that,
A spinner has 8 equal-sized sections. Six of the sections are green.
6/8 = 3/4.
6 out of 8 sections are green.
3/4 = 0.75.
a. What is the probability that the spinner will land on green?

Answer:
The missing numbers are 6, 3, and 75%.
Explanation:
In the above-given question,
given that,
6 out of 8.
6/8 = 3/4.
3/4 = 0.75.
0.75/100 = 75.
so the missing numbers are 6, 3, and 75%.

b. Use words to describe the probability.
It is _________ that the spinner will land on green.
Answer:
It is 6 out of 8 that the spinner will land on the green.
Explanation:
In the above-given question,
given that,
6 out of 8.
6/8 = 3/4.
3/4 = 0.75.
Question 9.
Marcus is rolling a number cube with sides labeled 1 to 6.
a. The probability that the number cube will _________ show 10 is _________.
Answer:
b. It is _________ that the number cube will show 10.
Answer:
Question 10.
Of the marbles in a bag, 3 are yellow, 2 are red, and 2 are blue. Sandra will randomly choose one marble from the bag.
a. The probability that Sandra will choose a blue marble from the bag is _________ out of _________, or _________.
Answer:
The probability that Sandra will choose a blue marble from the bag is 1 out of 7 marbles or 1/7.
Explanation:
In the above-given question,
given that,
Of the marbles in a bag, 3 are yellow, 2 are red, and 2 are blue.
Sandra will randomly choose one marble from the bag.
3 + 2 + 2 = 7.
1 out of 7.
1/7 is 0.142.
b. It is _________ that sandra will choose a blue marble from the bag.
Answer:
It is 1/7 that Sandra will choose a blue marble from the bag.
Explanation:
In the above-given question,
given that,
Of the marbles in a bag, 3 are yellow, 2 are red, and 2 are blue.
Sandra will randomly choose one marble from the bag.
3 + 2 + 2 = 7.
1 out of 7.
1/7.
Question 11.
Suppose you have a bag with 20 letter tiles in it, and 3 of the tiles are labeled Y. Suppose a second bag has 500 letter tiles in it, and 170 of the tiles are labeled Y. From which bag are you more likely to pick a tile that is labeled Y? Explain.

Answer:
We will choose the bag with 20 letter tiles.
Explanation:
In the above-given question,
given that,
you have a bag with 20 letter tiles in it, and 3 of the tiles are labeled Y.
20/3 = 6.6.
Suppose a second bag has 500 letter tiles in it, and 170 of the tiles are labeled Y.
500/170 = 2.9.
so we will choose the bag with 20 letter tiles.
Question 12.
Make Sense and Persevere Suppose you have a bag of 40 marbles, and 20 of them are white. If you choose a marble without looking, the probability that you choose a white marble is \(\frac{20}{40}\). Describe the probability.
Answer:
The probability is 20/40 is 0.5.
Explanation:
In the above-given question,
given that,
you have a bag of 40 marbles, and 20 of them are white.
If you choose a marble without looking, the probability that you choose a white marble is \(\frac{20}{40}\).
20/40 = 1/2.
1/2 = 0.5.
Question 13.
Suppose Nigel has a bag of colored wristbands, and he chooses one without looking. The bag contains a total of 25 wristbands and 6 of the wristbands are blue.

Answer:
1 out of 25 = 0.04.
Explanation:
In the above-given question,
given that,
Nigel has a bag of colored wristbands, and he chooses one without looking.
The bag contains a total of 25 wristbands and 6 of the wristbands are blue.
1 out of 25.
1/25.
a. What is the probability that Nigel will choose a blue wristband?
Answer:
The probability is 6/25.
Explanation:
In the above-given question,
given that,
Nigel has a bag of colored wristbands, and he chooses one without looking.
The bag contains a total of 25 wristbands and 6 of the wristbands are blue.
6 out of 25.
6/25.
so the probability that Nigel will choose a blue wristband.
b. Is it likely, unlikely, or neither likely nor unlikely that Nigel will choose a blue wristband?
Answer:
It is neither likely nor unlikely that Nigel will choose a blue wristband.
Explanation:
In the above-given question,
given that,
Nigel has a bag of colored wristbands, and he chooses one without looking.
The bag contains a total of 25 wristbands and 6 of the wristbands are blue.
6 out of 25.
6/25.
Question 14.
A box contains four equal-sized cards labeled 1, 3, 5, and 7. Tim will select one card from the box.
a. What is the probability that Tim will select a card labeled 4?
Answer:
The probability that Tim will select a card labeled 4 is 1/4.
Explanation:
In the above-given question,
given that,
A box contains four equal-sized cards labeled 1, 3, 5, and 7.
1, 3, 5, and 7.
4 out of 16.
4/16 = 1/4.
b. What is the probability that Tim will select a card labeled with a number less than 6?
Answer:
The probability that Tim will select a card labeled with a number less than 6 is 5/16.
Explanation:
In the above-given question,
given that,
The probability that Tim will select a card labeled with a number less than 6.
5 out of 16.
5/16.
0.3125.
c. What is the probability that Tim will select a card labeled with an odd number?
Answer:
The probability that Tim will select a card labeled with an odd number is 5/16.
Explanation:
In the above-given question,
given that,
The probability that Tim will select a card labeled with an odd number.
5 out of 16.
5/16.
0.3125.
Question 15.
Model with Math Henry is going to color a spinner with 10 equal-sized sections. Three of the sections will be orange and 7 of the sections will be purple. Is this spinner fair? If so, explain why. If not, explain how to make it a fair spinner.
Answer:
Yes, It is fair.
Explanation:
In the above-given question,
given that,
Henry is going to color a spinner with 10 equal-sized sections.
Three of the sections will be orange and 7 of the sections will be purple.
3/10 and 7/10.
3 out of 10.
7 out of 10.
7 + 3 = 10.
so it is fair.
Question 16.
Higher Order Thinking Without being able to calculate probability, describe the likelihood that the following event will occur.
All 21 students in a class share the same birthday.
Answer:
The probability is 1.
Explanation:
In the above-given question,
given that,
Without being able to calculate probability,
describe the likelihood that the following event will occur.
All 21 students in a class share the same birthday.
21/ 21 = 1.
it is the like event.
Assessment Practice
Question 17.
After many studies, a researcher finds that the probability that a word recognition app correctly interprets a handwritten word is \(\frac{9}{10}\). Which statement is true?
A It is impossible that the handwritten word will be correctly interpreted.
B It is unlikely that the handwritten word will be correctly interpreted.
C It is likely that the handwritten word will be correctly interpreted.
D It is certain that the handwritten word will be correctly interpreted.
Answer:
Option A is correct.
Explanation:
In the above-given question,
given that,
After many studies, a researcher finds that the probability that a word recognition app correctly interprets a handwritten word is 9/10.
9 out of 10 words.
9/10.
it is impossible that the handwritten word will be correctly interpreted.
so option A is correct.
Question 18.
A bag contains 8 letter tiles of the same size. The tiles are labeled either A, B, C, D, E, or F. Three of the tiles are labeled C. If Corey selects 1 tile from the bag without looking, is the selection of letters fair? Explain.
Answer:
Yes, the selection of letters is fair.
Explanation:
In the above-given question,
given that,
A bag contains 8 letter tiles of the same size.
The tiles are labeled either A, B, C, D, E, or F.
Three of the tiles are labeled C.
1 out of 8.
1/8.
so the selection of letters is fair.
Lesson 7.2 Understand Theoretical Probability
Solve & Discuss It!
Betty and Carl will conduct an experiment. They will flip a coin 100 times and record the result of each flip. What should they expect the results of their experiment to be? Justify your answer.
I can… determine the theoretical probability of an event.
Answer:
The theoretical probability of an event is 1/100, 2/100, ….. 100/100.
Explanation:
In the above-given question,
given that,
Betty and Carl will conduct an experiment.
They will flip a coin 100 times and record the result of each flip.
so the theoretical probability of an event is,
1/100, 2/100, .. 50/100, …. 100/100.
Focus on math practices
Look for Relationships How would their expected results change if Betty and Carl flipped a coin 500 times?
Essential Question
How can the probability of an event help make predictions?
Try It!
If Talia and Yoshi redesign their spinner to have 14 sections instead of 16 sections, would they likely have more or fewer winners? Explain why.
Answer:
They have fewer winners.
Explanation:
In the above-given question,
given that,
If Talia and Yoshi redesign their spinner to have 14 sections instead of 16 sections.
14/2 = 7.
16/2 = 8.
so they have fewer winners.
Convince Me! If there are always 2 red sections, how does the number of total sections in the spinner relate to the theoretical probability of winning this game?
Answer:
The probability of winning this game is 2 out of 14.
Explanation:
In the above-given question,
given that,
If there are always 2 red sections, how does the number of total sections in the spinner relate to the theoretical probability of winning this game?
2/14 = 1/7.
so the probability of the game is 2/14.
Try It!
Joaquin wants to reduce the number of winners so he does not have to prepare as many prizes. Choose another sum he could use as a winning sum, and predict the number of winners if 500 people play his game.
Answer:
The number of winners is 10.
Explanation:
In the above-given question,
given that,
Joaquin wants to reduce the number of winners so he does not have to prepare as many prizes.
500/50 = 10.
so the number of winners is 10.
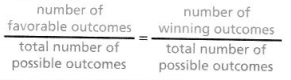
KEY CONCEPT
You can determine the theoretical probability of an event, Plevent), if you know all the possible outcomes and they are equally likely.
+ number of favorable outcomes
![]()
You can use theoretical probability and proportional reasoning to make predictions, such as in a game situation.
Do You Understand?
Question 1.
Essential Question How can the probability of an event help make predictions?
Answer:
The number of favorable outcomes/ total number of possible outcomes is equal to the number of winning outcomes/ total number of possible outcomes.
Explanation:
In the above-given question,
given that,
the probability of an event help make predictions are:
the number of favorable outcomes/ total number of possible outcomes is equal to the number of winning outcomes/ total number of possible outcomes.
Question 2.
Construct Arguments A game board has a spinner with 10 equal-sized sections, of which 4 are green, 3 are blue, 2 are yellow, and 1 is red. What is the sum of the probabilities of the pointer landing in the green, blue, yellow, and red sections? Explain.
Answer:
p(event) = 1/5.
Explanation:
In the above-given question,
given that,
A game board has a spinner with 10 equal-sized sections, of which 4 are green, 3 are blue, 2 are yellow, and 1 is red.
the sum of the probabilities of the pointer landing in the green, blue, yellow, and red.
p(event) = number of favorable outcomes/total number of possible outcomes.
p(event) = 4 / 10 + 4 + 3 + 2 + 1.
p(event) = 4/20.
p(event) = 1/5.
Question 3.
Reasoning What does it mean that there is an equal theoretical probability of each outcome? Explain.
Answer:
The theoretical probability of each outcome = number of favorable outcomes/ total number of possible outcomes.
Explanation:
In the above-given question,
given that,
the probability of an event help make predictions are:
the number of favorable outcomes/ total number of possible outcomes is equal to the number of winning outcomes/ total number of possible outcomes.
Do You Know How?
In 4-6, Monique rolls a six-sided number cube labeled 1 to 6.
Question 4.
Find P(rolling a 4).
Answer:
p(rolling a 4) = 4/6.
Explanation:
In the above-given question,
given that,
Monique rolls a six-sided number cube labeled 1 to 6.
p(rolling a 4) = number of favorable outcomes/ total number of possible outcomes.
p(rolling a 4) = 4/6.
Question 5.
Find P(rolling an odd number).
Answer:
p(rolling an odd number) = 3/6.
Explanation:
In the above-given question,
given that,
Monique rolls a six-sided number cube labeled 1 to 6.
p(rolling an odd number) = number of favorable outcomes/ total number of possible outcomes.
p(rolling an odd number) = 3/6.
Question 6.
If Monique rolls the number cube 12 times, how many times would she expect a number greater than 4 to be rolled?
Answer:
The number of times would she expect a number greater than 4 to be rolled = 3.
Explanation:
In the above-given question,
given that,
If Monique rolls the number cube 12 times.
p(event) = 4/12.
p(event) = 1/3.
so the number of times would she expect a number greater than 4 to be rolled = 3.
Practice & Problem Solving
Leveled Practice In 7-9, complete each statement.
Question 7.
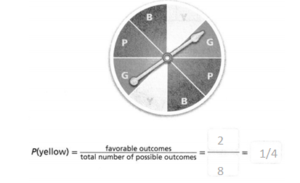
A spinner has 8 equal-sized sections. To win the game, the pointer must land on a yellow section.
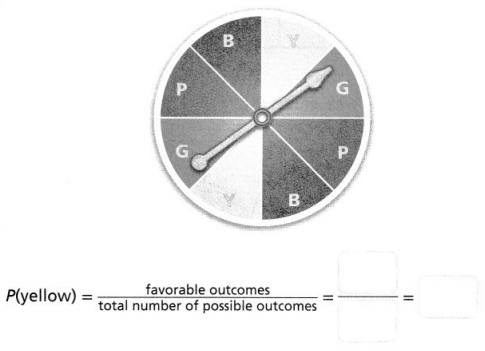
Answer:
P(yellow) = 2/8 = 1/4.
Explanation:
In the above-given question,
given that,
A spinner has 8 equal-sized sections.
2/8 = 1/4.
so to win the game the pointer must land on a yellow section is 1/4.
Question 8.
Natalie is playing a game using a fair coin. Contestants win the game if the fair coin lands tails up.
The theoretical probability that the coin will land tails up is _________.
If 250 contestants play the game, about of them are expected to win.
Answer:
250/250 = 1.
Explanation:
In the above-given question,
given that,
Natalie is playing a game using a fair coin.
Contestants win the game if the fair coin lands tail up.
If 250 contestants play the game, about of them are expected to win.
so the theoretical probability = 1.
Question 9.
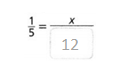
In a different game, the probability of correctly guessing which of 5 boxes contains a tennis ball is \(\frac{1}{5}\). About how many winners would be expected if 60 contestants play the game?

X = _________ winners
Answer:
The number of winners would be expected if 60 contestants play the game = 12.
Explanation:
In the above-given question,
given that,
the probability of correctly guessing which of 5 boxes contains a tennis ball is 1/5.
1/5 = x/60.
x = 1/5 x 60.
x = 12.
so the number of winners would be expected if 60 contestants play the game = 12.
Question 10.
Make Sense and Persevere A 12-sided solid has equal-sized faces numbered 1 to 12.
a. Find P(number greater than 10).
b. Find P(number less than 5).
c. If the 12-sided solid is rolled 200 times, how many times would you expect either a 4, 6, or 9 to be rolled?
Answer:
a. p (number gteater than 10) = 10/12.
b. p(number less than 5) = 5/12.
c. 12-sided solid is rolled 200 times = 6.
Explanation:
In the above-given question,
given that,
A 12-sided solid has equal-sized faces numbered 1 to 12.
a. p (number gteater than 10) = 10/12.
b. p(number less than 5) = 5/12.
c. 12-sided solid is rolled 200 times = 6.
Question 11.
Tamara finds the sum of two number cubes rolled at the same time. The chart below shows all possible sums from the 36 possible combinations when rolling two number cubes. How many times should Tamara expect the sum of the two cubes to be equal to 5 if she rolls the two number cubes 180 times?
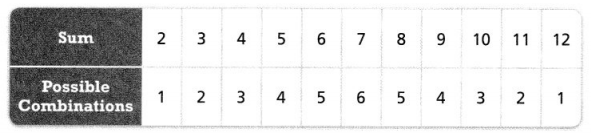
Answer:
The number of times should Tamara expect the sum of the two cubes to be equal to 5 is 36 times.
Explanation:
In the above-given question,
given that,
Tamara finds the sum of two number cubes rolled at the same time.
The chart below shows all possible sums from the 36 possible combinations when rolling two number cubes.
180/5 = 36.
so the number of times should Tamara expect the sum of the two cubes to be equal to 5 is 36 times.
Question 12.
Higher Order Thinking A store is giving every customer who enters the store a scratch-off card labeled with numbers from 1 to 10. It is equally likely that any of the numbers from 1 to 10 will be labeled on a given card. If the card is an even number, the customer gets a 15% discount on a purchase. If the card is an odd number greater than 6, the customer gets a 30% discount. Otherwise, the discount is 20%.
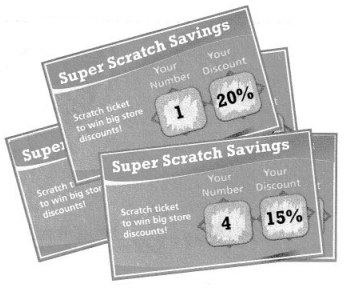
a. What is the probability for each discount?
15% discount: _________
20% discount: _________
30% discount: _________
Answer:
A card is an even number the customer gets a 15% discount.
if the card is an odd number greater than 6 the customer gets a 30% discount.
a card is an odd number the customer gets a 20% discount.
Explanation:
In the above-given question,
given that,
A store is giving every customer who enters the store a scratch-off card labeled with numbers from 1 to 10.
It is equally likely that any of the numbers from 1 to 10 will be labeled on a given card.
If the card is an even number, the customer gets a 15% discount on a purchase.
A card is an even number the customer gets a 15% discount.
if the card is an odd number greater than 6 the customer gets a 30% discount.
a card is an odd number the customer gets a 20% discount.
b. The store manager gives out 300 scratch-off cards. Which discount will the greatest number of customers likely receive? Explain.
Answer:
The greatest number of customers likely receive is 3%.
Explanation:
In the above-given question,
given that,
The store manager gives out 300 scratch-off cards.
300/100 = 3.
so the greatest number of customers likely receive is 3%.
Assessment Practice
Question 13.
A spinner is divided into 4 equal parts. 1 part is colored red, 2 parts are colored blue, and 1 part is colored yellow. The spinner is spun 1,000 times. Select all of the reasonable possible outcomes.
☐ The spinner lands on blue 445 times.
☐ The spinner lands on red 430 times.
☐ The spinner lands on blue 290 times.
☐ The spinner lands on yellow 200 times.
☐ The spinner lands on red 290 times.
Answer:
The spinner lands on blue 445 times.
Explanation:
In the above-given question,
given that,
A spinner is divided into 4 equal parts.
1 part is colored red, 2 parts are colored blue, and 1 part is colored yellow.
The spinner is spun 1,000 times.
1000/2 = 500.
so the spinner lands on blue 445 times.
Question 14.
One thousand five hundred runners have signed up for a marathon. The probability of a runner finishing the race is \(\frac{11}{12}\). Approximately how many runners are expected to finish the race?
Answer:
The number of runners is expected to finish the race = 125.
Explanation:
In the above-given question,
given that,
One thousand five hundred runners have signed up for a marathon.
The probability of a runner finishing the race is \(\frac{11}{12}\).
11/12 = 0.916.
1500 / 12 = 125.
so the number of runners are expected to finish the race = 125.
Lesson 7.3 Understand Experimental Probability
Solve & Discuss It!
Kevin is awarded a penalty shot. He will either score a goal or not score a goal. Are both outcomes equally likely? Explain.
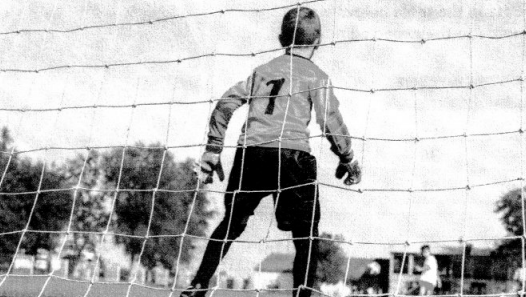
I can… determine the experimental probability of an event.
Look for Relationships
What might affect the outcome?
Answer:
Yes, both outcomes are equally likely.
Explanation:
In the above-given question,
given that,
Kevin is awarded a penalty shot.
He will either score a goal or not score a goal.
so both outcomes are equally likely.
Focus on math practices
Construct Arguments Lowe Senior High School’s soccer team won 12, lost 5, and tied in 3 of their first 20 games this season. Which outcome is most likely for the team’s next game? Explain your reasoning.

Answer:
The outcome is most likely for the team’s next game is 0.15.
Explanation:
In the above-given question,
given that,
Lowe Senior High School’s soccer team won 12, lost 5, and tied in 3 of their first 20 games this season.
12/5 = 122.6.
3/20 = 0.15.
so the outcome is most likely for the team’s next game is 0.15.
Essential Question
How is experimental probability similar to and different from theoretical probability?
Try It!
During the second day of the school fair, Talia and Yoshi recorded 43 winners out of a total of 324 players. How does the actual number of winners compare to the expected number of winners?
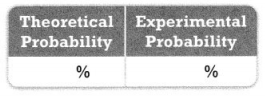
Theoretical Probability
P(red) = \(\frac{1}{8}\) = 12.5%
Experimental Probability
\(\frac{1}{324}\) ≈ ________ %
This experimental probability is ________ than the theoretical probability.
There were ________ winners than expected.
Convince Me! Will experimental probability always be close to theoretical probability? Explain.
Try It!
Amir and Marvin continue until they each flip a coin 200 times. How do you expect Amir’s results and Marvin’s results to compare? How will their results compare with expected results based on theoretical probability?
Answer:
The expected results are based on theoretical probability = 100.
Explanation:
In the above-given question,
given that,
Amir and Marvin continue until they each flip a coin 200 times.
200/2 = 100.
so the expected results are based on theoretical probability = 100.
KEY CONCEPT
Relative frequency, or experimental probability, is based on the actual results of an experiment, while theoretical probability is based on calculated results from the knowledge of the possible outcomes. Experimental probability and theoretical probability may be close but are rarely exactly the same.

The experimental probability tends to get closer to the theoretical probability of an experiment as more trials are conducted.
Do You Understand?
Question 1.
Essential Question How is experimental probability similar to and different from theoretical probability?
Answer:
The number of times an event occurs / total number of times the experiment is carried out.
Explanation:
In the above-given question,
given that,
Relative frequency, or experimental probability, is based on the actual results of an experiment,
while theoretical probability is based on calculated results from the knowledge of the possible outcomes.
Experimental probability = number of times an event occurs/ total number of times the experiment is carried out.
this value changes each time an experiment is carried out.
Question 2.
Construct Arguments How can experimental probability be used to make predictions?
Answer:
The number of times an event occurs / total number of times the experiment is carried out.
Explanation:
In the above-given question,
given that,
Relative frequency, or experimental probability, is based on the actual results of an experiment,
while theoretical probability is based on calculated results from the knowledge of the possible outcomes.
Experimental probability = number of times an event occurs/ total number of times the experiment is carried out.
this value changes each time an experiment is carried out.
Question 3.
Reasoning is experimental probability always close to theoretical probability? Explain.
Answer:
The number of times an event occurs / total number of times the experiment is carried out.
Explanation:
In the above-given question,
given that,
Relative frequency, or experimental probability, is based on the actual results of an experiment,
while theoretical probability is based on calculated results from the knowledge of the possible outcomes.
Experimental probability = number of times an event occurs/ total number of times the experiment is carried out.
this value changes each time an experiment is carried out.
Do You Know How?
In 4–6, complete each statement. Kelly flips a coin 20 times. The results are shown in the table, where “H” represents the coin landing heads up and “T” represents the coin landing tails up.
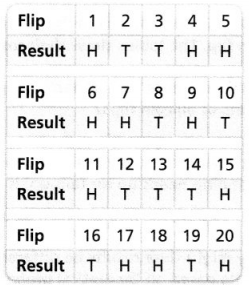
Question 4.
The theoretical probability that the coin will land heads up is _________.
Answer:
The theoretical probability that the coin will land heads up is 9/20 times.
Explanation:
In the above-given question,
given that,
Kelly flips a coin 20 times.
the results were shown in the table.
T represents the coin landing tails up.
so the theoretical probability that the coin will land heads up is 9/20 times.
Question 5.
Based on the data, the experimental probability that the coin will land heads up is __________.
Answer:
The experimental probability that the coin will land heads up is 11/20 times.
Explanation:
In the above-given question,
given that,
Kelly flips a coin 20 times.
the results were shown in the table.
H represents the coin landing the heads up.
so the experimental probability that the coin will land heads up is 11/20 times.
Question 6.
The experimental probability is _________ than the theoretical probability.
Answer:
The experimental probability is greater than the theoretical probability.
Explanation:
In the above-given question,
given that,
Relative frequency, or experimental probability, is based on the actual results of an experiment,
while theoretical probability is based on calculated results from the knowledge of the possible outcomes.
Experimental probability = number of times an event occurs/ total number of times the experiment is carried out.
this value changes each time an experiment is carried out.
Practice & Problem Solving
Leveled Practice In 7 and 8, complete each statement.
Question 7.
The table shows the results of spinning a wheel 80 times.
What is the relative frequency of the event “spin a 3”?
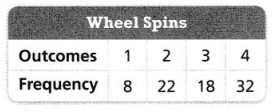
The relative frequency of the wheel landing on 3 is
\(\frac{\text { number of times an event occurs }}{\text { total number of trials }}\) = \(\frac{}{}\) = _________%
Answer:
The relative frequency of the wheel landing on 3 is 6 times.
Explanation:
In the above-given question,
given that,
The table shows the results of spinning a wheel 80 times.
The relative frequency of the wheel landing on 3 is
18/3 = 6.
so the relative frequency of the wheel landing on 3 is 6 times.
Question 8.
Liz flips a coin 50 times. The coin lands heads up 20 times and tails up 30 times. Complete each statement.
The theoretical probability of the coin landing heads up is __________
Based on Liz’s results, the experimental probability of the coin landing heads up is __________.
The theoretical probability is __________ than the experimental probability in this experiment.
Answer:
The theoretical probability of the coin landing heads up = 20/50.
the experimental probability of the coin landing heads up = 30/50.
the theoretical probability is less than the experimental probability in this experiment.
Explanation:
In the above-given question,
given that,
Liz flips a coin 50 times.
The coin lands head up 20 times and tails up 30 times.
20 out of 50 is 20/50.
30 out of 50 is 30/50.
The theoretical probability of the coin landing heads up = 20/50.
the experimental probability of the coin landing heads up = 30/50.
the theoretical probability is less than the experimental probability in this experiment.
Question 9.
Jess spins a pointer 25 times and finds an experimental probability of the pointer landing on 3 to be \(\frac{4}{25}\), or 16%. The theoretical probability of the spinner landing on 3 is , or 25%. Why might there be a significant difference between the theoretical and experimental probabilities?
Answer:
The experimental probability is less than the theoretical probability.
Explanation:
In the above-given question,
given that,
Jess spins a pointer 25 times and finds an experimental probability of the pointer landing on 3 to be \(\frac{4}{25}\), or 16%.
The theoretical probability of the spinner landing on 3 is, or 25%.
4/25 = 0.16.
0.16/100 = 16.
16 is less than 25.
so the experimental probability is less than the theoretical probability.
Question 10.
The table shows the results of a survey of 100 people randomly selected at an airport. Find the experimental probability that a person is going to City E.
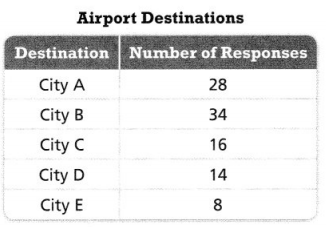
Answer:
The experimental probability that a person is going to city E is 8/100.
Explanation:
In the above-given question,
given that,
The table shows the results of a survey of 100 people randomly selected at an airport.
city A is 28 responses.
City B is 34 responses.
city C is 16 responses.
city D is 14 responses.
city E is 8 responses.
so the experimental probability that a person is going to city E is 8/100.
Question 11.
The theoretical probability of selecting a consonant at random from a list of letters in the alphabet is \(\frac{21}{26}\) Wayne opens a book, randomly selects a letter on the page, and records the letter. He repeats the experiment 200 times. He finds P(consonant) = 60%. How does the theoretical probability differ from the experimental probability? What are some possible sources for this discrepancy?
Answer:
Some possible sources for this discrepancy = 333.3.
Explanation:
In the above-given question,
given that,
The theoretical probability of selecting a consonant at random from a list of letters in the alphabet is \(\frac{21}{26}\) Wayne opens a book, randomly selects a letter on the page and records the letter.
He repeats the experiment 200 times.
He finds P(consonant) = 60%.
21/26 = 0.8076.
60/100 = 6/10.
6/10 = 0.6.
200/ 0.6 = 333.3.
Question 12.
Higher Order Thinking Seven different names are written onto sticks and placed into a cup. A stick is chosen 100 times, out of which the name Grace is chosen 23 times. How do the theoretical probability and experimental probability compare? Explain why there is a discrepancy between them, if there is any.

Answer:
The discrepancy between them is 4.347.
Explanation:
In the above-given question,
given that,
Seven different names are written onto sticks and placed into a cup.
A stick is chosen 100 times, out of which the name Grace is chosen 23 times.
100/23 = 4.347.
so the discrepancy between them is 4.347.
Question 13.
Each of three friends flips a coin 36 times. Angel records “tails” 20 times. Michael records “tails” 17 times. Fernanda records “tails” 23 times.
a. Find the relative frequency with which each friend records “tails”.
Answer:
The relative frequency with which each friend records tails is 15.
Explanation:
In the above-given question,
given that,
Each of three friends flips a coin 36 times.
Angel records “tails” 20 times.
Michael records “tails” 17 times.
Fernanda records “tails” 23 times.
20 + 17 + 23 = 60.
60/4 = 15.
so the relative frequency with which each friend records tails is 15.
b. Which friend has a relative frequency that is closest to the theoretical probability of flipping “tails” 36 times? Explain.
Answer:
Fernanda has a relative frequency that is closest to the theoretical probability of flipping tails.
Explanation:
In the above-given question,
given that,
Each of three friends flips a coin 36 times.
Angel records “tails” 20 times.
Michael records “tails” 17 times.
Fernanda records “tails” 23 times.
20 + 17 + 23 = 60.
60/4 = 15.
so the relative frequency that is closest to the theoretical probability of flipping tails is Fernanda.
Assessment Practice
Question 14.
In a survey, 125 people were asked to choose one card out of five cards labeled 1 to 5. The results are shown in the table. Compare the theoretical probability and experimental probability of choosing a card with the number 1.
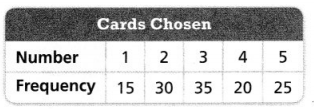
Answer:
The theoretical probability and experimental probability of choosing a card with the number 1 is 0.12 and 0.2.
Explanation:
In the above-given question,
given that,
In a survey, 125 people were asked to choose one card out of five cards labeled 1 to 5.
the theoretical property is 15/125.
15/125 = 0.12.
the experimental property is 25/125.
25/125 = 0.2.
so the theoretical probability and experimental probability of choosing a card with the number 1 are 0.12 and 0.2.
Question 15.
A basketball player makes 65% of all free throws in her first 5 seasons. In her 6th season she makes 105 out of 150 free throws. How does the observed frequency of her 6th season compare to the expected frequency? Provide a possible explanation for any similarities or differences in the frequencies.
Answer:
The difference is 0.57.
Explanation:
In the above-given question,
given that,
A basketball player makes 65% of all free throws in her first 5 seasons.
In her 6th season, she makes 105 out of 150 free throws.
105/150 = 0.7.
65/5 = 13%.
0.7 – 0.13 = 0.57.
so the difference is 0.57.
Lesson 7.4 Use Probability Models
Explain It!
The Chess Club has 8 members. A new captain will be chosen by randomly selecting the name of one of the members. Leah and Luke both want to be captain. Leah says the chance that she will be chosen as captain is \(\frac{1}{2}\) because she is either chosen for captain or she is not. Luke says the chance that he is chosen is \(\frac{1}{8}\).
I can… use probability models to find probabilities of events.

A. Construct Arguments Do you agree with Leah’s statement? Use a mathematical argument to justify your answer.
Answer:
Yes, I agree with Leah’s statement.
Explanation:
In the above-given question,
given that,
The Chess Club has 8 members.
A new captain will be chosen by randomly selecting the name of one of the members.
Leah and Luke both want to be captains.
Leah says the chance that she will be chosen as captain is \(\frac{1}{2}\) because she is either chosen for a captain or she is not.
so I agree with Leah’s statement.
B. Construct Arguments Do you agree with Luke’s statement? Use . a mathematical argument to justify your answer.
Answer:
Yes, Luke was also correct.
Explanation:
In the above-given question,
given that,
The Chess Club has 8 members.
A new captain will be chosen by randomly selecting the name of one of the members.
Leah and Luke both want to be captains.
Luke says the chance that he is chosen is \(\frac{1}{8}\).
so I agree with Luke’s statement.
Focus on math practices
Look for Relationships How does the probability of Leah being chosen captain compare to the probability of Luke being chosen captain?
Essential Question
How can a model be used to find the probability of an event?
Try It!
Mr. Campbell decides that too many students are getting a pass on homework. He adds 10 yellow marbles to the jar. Tell whether each part of the probability model does or does not change.
The sample space _________ change. Each event within the sample space change. The probability of each event ________ change.
The new probability of drawing a red marble is P(R) = \(\frac{1}{}\)
Answer:
The sample space does not change.
Each event within the sample space change.
The probability of each event does not change.
Explanation:
In the above-given question,
given that,
Mr. Campbell decides that too many students are getting a pass on homework.
He adds 10 yellow marbles to the jar.
so the sample space does not change.
each event within the sample space change.
the probability of each event does not change.
Convince Me! How does a probability model help you predict how likely an event is to occur?
Try It!
To reduce the number of homework passes, which color of marble should Ms. Stillman use as the pass on homework? Explain.
Answer:
He should use red color marbles.
Explanation:
In the above-given question,
given that,
to reduce the number of homework passes,
he should use red color marbles.
KEY CONCEPT
A probability model can help you evaluate a chance process and its outcomes. You can develop a model using theoretical or experimental probability. A probability model consists of the sample space of an action, events within the sample space, and probabilities associated with each event.
For rolling a number cube labeled from 1 through 6: Sample space, S = {1, 2, 3, 4, 5, 6}
P(1) = \(\frac{1}{6}\)
P(2) = \(\frac{1}{6}\)
P(3) = \(\frac{1}{6}\)
P(4) = \(\frac{1}{6}\)
P(5) = \(\frac{1}{6}\)
P(6) = \(\frac{1}{6}\)
Do You Understand?
Question 1.
Essential Question How can a model be used to find the probability of an event?
Answer:
The probability of an event is to evaluate a chance process and its outcomes.
Explanation:
In the above-given question,
given that,
A probability model can help you evaluate a chance process and its outcomes. You can develop a model using theoretical or experimental probability. A probability model consists of the sample space of action, events within the sample space, and probabilities associated with each event.
For rolling a number cube labeled from 1 through 6: Sample space, S = {1, 2, 3, 4, 5, 6}.
so the probability of an event is to evaluate a chance process and its outcomes.
Question 2.
Construct Arguments How can you check the sample space of a probability model?
Answer:
The probability of an event is to evaluate a chance process and its outcomes.
Explanation:
In the above-given question,
given that,
A probability model can help you evaluate a chance process and its outcomes. You can develop a model using theoretical or experimental probability. A probability model consists of the sample space of action, events within the sample space, and probabilities associated with each event.
For rolling a number cube labeled from 1 through 6: Sample space, S = {1, 2, 3, 4, 5, 6}.
so the probability of an event is to evaluate a chance process and its outcomes.
Question 3.
Reasoning How does developing a probability model based on experimental probability help you evaluate a situation or make an estimate? Explain.
Answer:
The probability of an event is to evaluate a chance process and its outcomes.
Explanation:
In the above-given question,
given that,
A probability model can help you evaluate a chance process and its outcomes. You can develop a model using theoretical or experimental probability. A probability model consists of the sample space of action, events within the sample space, and probabilities associated with each event.
For rolling a number cube labeled from 1 through 6: Sample space, S = {1, 2, 3, 4, 5, 6}.
so the probability of an event is to evaluate a chance process and its outcomes.
Do You Know How?
Question 4.
Develop a probability model for the spinner shown.

Answer:
P(1) = \(\frac{1}{5}\)
P(2) = \(\frac{1}{5}\)
P(3) = \(\frac{1}{5}\)
P(4) = \(\frac{1}{5}\)
P(5) = \(\frac{1}{5}\)
Explanation:
In the above-given question,
given that,
the spinner is on the 2 and 5.
if the spinner is on the 1 through 1/5.
if the spinner is on the 2 through 2/5.
if the spinner is on the 3 through 3/5.
if the spinner is on the 4 through 4/5.
if the spinner is on the 5 through 5/5.
Question 5.
Mr. Henry has a basket full of fruit. He does not know how many pieces of fruit are in the basket or the types of fruit. Each of the 20 students in his class selects one piece of fruit from the basket without looking, notes its fruit type, and then puts it back in the basket. Based on the results shown in the table, what can the students conclude about the probability of selecting an apple?
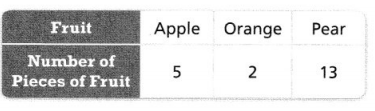
Answer:
The probability of selecting an apple is 4.
Explanation:
In the above-given question,
given that,
Mr. Henry has a basket full of fruit.
He does not know how many pieces of fruit are in the basket or the types of fruit.
Each of the 20 students in his class selects one piece of fruit from the basket without looking, notes its fruit type, and then puts it back in the basket.
the number of pieces of fruit of apple is 5.
20/5 = 4.
4 x 5 = 20.
so the probability of selecting an apple is 4.
Question 6.
The probability model based on experimental probability for randomly selecting a marble from a bag is P(green) = \(\frac{18}{40}\), P(blue) = \(\frac{14}{40}\), and P(white) = \(\frac{8}{40}\). About how many marbles of each color are in the bag if there are 60 total marbles?
Answer:
The number of marbles of each color is in the bag if there are 60 total marbles = 25, 20, and 15.
Explanation:
In the above-given question,
given that,
p(green) = 18/40.
p(blue) = 14/40.
p(white) = 8/40.
18 + 14 + 8 = 40.
25 + 20 + 15 = 60.
so p(green) = 25.
p(blue) = 20.
p(white) = 15.
so the number of marbles of each color is in the bag if there are 60 total marbles = 25, 20, and 15.
Practice & Problem Solving
Question 7.
Murray spins the pointer of the spinner shown at the right.
a. What is the sample space for the probability model?
Answer:
The sample space for the probability model is 3/8.
Explanation:
In the above-given question,
given that,
Murray spins the pointer of the spinner shown at the right.
the spinner is on the 3.
p(3/8) = 3/8.
so the sample space for the probability model is 3/8.
b. What is the probability of each event in the sample space?
Answer:
The probability of each event in the sample space = 1/8, 3/8, and 5/8.
Explanation:
In the above-given question,
given that,
Murray spins the pointer of the spinner shown at the right.
if the spinner is on the 1.
p(1/8) = 1/8.
if the spinner is on the 3.
p(3/8) = 3/8.
so the probability of each event in the sample space = 1/8, 3/8, and 5/8.
Question 8.
Rafael spins the pointers of the two spinners shown at the right. Find the probability of each possible sum.
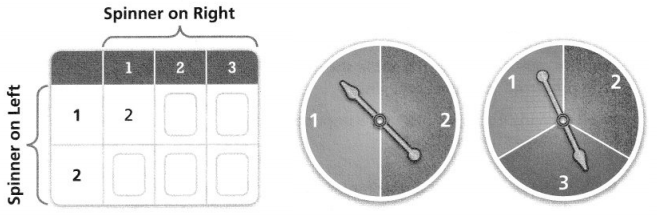
P(sum 2) = __________
P(sum 3) = __________
P(sum 4) = __________
P(sum 5) = __________
Answer:
p(sum 2) =
p(sum 3) =
p(sum 4) =
p(sum 5) =
Explanation:
In the above-given question,
given that,
Question 9.
Be Precise An arts and crafts store has a crate that contains glass, wood, and brass beads. Friends take turns choosing a bead without looking, recording the bead type, and returning the bead to the crate. The table shows the results of 300 selections.
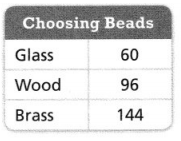
a. Write a probability model for choosing a bead.
Answer:
The model for choosing a bead = p(0.2), p(0.32), and p(0.48).
Explanation:
In the above-given question,
given that,
An arts and crafts store has a crate that contains glass, wood, and brass beads.
Friends take turns choosing a bead without looking, recording the bead type, and returning the bead to the crate.
glass = p(60/300) = p(0.2).
wood = p(96/300) = p(0.32).
brass = p(144/300) = p(0.48).
so the model for choosing a bead = p(0.2), p(0.32), and p(0.48).
b. Based on the frequencies in the table, estimate the number of each type of bead that will be chosen if the friends select a total of 450 beads from the crate.
Answer:
The friends select a total of 450 beads from the crate = p(0.2), p(0.32), and p(0.48).
Explanation:
In the above-given question,
given that,
An arts and crafts store has a crate that contains glass, wood, and brass beads.
Friends take turns choosing a bead without looking, recording the bead type, and returning the bead to the crate.
60 + 40 = 100.
96 + 54 = 150.
144 + 56 = 200.
100 + 150 + 200 = 450.
glass = p(100/450) = p(0.2).
wood = p(150/450) = p(0.32).
brass = p(200/450) = p(0.48).
so the friends select a total of 450 beads from the crate = p(0.2), p(0.32), and p(0.48).
Question 10.
A bag contains 14 green, 12 orange, and 19 purple tennis balls.
a. Create a probability model for choosing a tennis ball from the bag.
Answer:
The probability model for choosing a tennis ball from the bag = p(0.3), p(0.2), and p(0.4).
Explanation:
In the above-given question,
given that,
A bag contains 14 green, 12 orange, and 19 purple tennis balls.
14 + 12 + 19 = 45.
p(green) = p(14/45).
p(orange) = p(12/45).
p(purple) = p(19/45).
so the probability model for choosing a tennis ball from the bag = p(0.3), p(0.2), and p(0.4).
b. Suppose a tennis ball is randomly selected and then replaced 75 times. How many orange tennis balls do you expect? Explain.
Answer:
The number of orange tennis balls does you expert = p(20/45).
Explanation:
In the above-given question,
given that,
Suppose a tennis ball is randomly selected and then replaced 75 times.
14 + 11 = 25.
12 + 8 = 20.
19 + 11 = 30.
25 + 20 + 30 = 75.
so the number of orange tennis balls does you expert = p(20/45).
Question 11.
Given that Pred pepper) = \(\frac{3}{5}\), write another probability statement to complete the probability model of a random pepper selection from the box below.
Answer:
The probability model of a random pepper is p(pepper) = 5/14.
Explanation:
In the above-given question,
given that,
P(red pepper) = \(\frac{3}{5}\).
total there are 14 trays.
I chooses 5 trays.
p(pepper) = p(5/14).
so the probability model of a random pepper is p(pepper) = 5/14.
Question 12.
Higher Order Thinking A survey asked 600 people for their favorite genre of book. The table shows the number of people who preferred four possible genres.
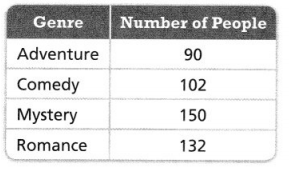
a. How many people surveyed responded with a genre that is not listed in the table?
Answer:
The number of people surveyed responded with a genre that is not listed in the table = 126.
Explanation:
In the above-given question,
given that,
A survey asked 600 people for their favorite genre of book.
the people who selected Adventure is 90.
the people who selected comedy is 102.
the people who selected Mystery is 150.
the people who selected Romance is 132.
90 + 102 + 150 + 132 = 474.
600 – 474 = 126.
so the number of people surveyed responded with a genre that is not listed in the table = 126.
b. Find the probabilities and complete a probability model to describe each response, including “other genre”.
Answer:
The probabilities are p(0.18), p(0.21), p(0.31), and p(0.27).
Explanation:
In the above-given question,
given that,
A survey asked 600 people for their favorite genre of book.
the people who selected Adventure is 90.
the people who selected comedy is 102.
the people who selected Mystery is 150.
the people who selected Romance is 132.
p(90/474) = p(0.18).
p(102/474) = p(0.21).
p(150/474) = p(0.31).
p(132/474) = p(0.27).
so the probabilities are p(0.18), p(0.21), p(0.31), and p(0.27).
Assessment Practice
Question 13.
One hundred people buy gum balls from a gum ball machine. 45 of them get a red gum ball, 40 get a blue gum ball and 15 get a yellow gum ball.
PART A
Develop a probability model to predict the color of the next gum ball purchased. Compare the probability of getting a red gum ball to the probability of getting a yellow gum ball.
Answer:
The probabilities are p(0.45), p(0.4), and p(0.15).
Explanation:
In the above-given question,
given that,
One hundred people buy gumballs from a gumball machine.
45 of them get a red gumball, 40 get a blue gumball and 15 get a yellow gumball.
p(red) = p(45/100).
p(blue) = p(40/100).
p(yellow) = p(15/100).
so the probabilities are p(0.45), p(0.4), and p(0.15).
PART B
Of the next 10 people to buy gum balls, 7 get yellow, 1 gets red and 2 get blue. Explain a possible reason for this outcome.
Answer:
The probabilities are p(0.7), p(0.1), and p(0.2).
Explanation:
In the above-given question,
given that,
One hundred people buy gumballs from a gumball machine.
45 of them get a red gumball, 40 get a blue gumball and 15 get a yellow gumball.
p(red) = p(1/10).
p(blue) = p(2/10).
p(yellow) = p(7/10).
so the probabilities are p(0.7), p(0.2), and p(0.1).
Topic 7 MID-TOPIC CHECKPOINT
Question 1.
Vocabulary How does the theoretical probability of the event “flip heads” change when a coin is flipped more times in an experiment? Lesson 7-2
A. increases; there are more chances for heads to be flipped
B. decreases; there are more chances for tails to be flipped
C. does not change
D. increases; all values increase
Answer:
Option A is correct.
Explanation:
In the above-given question,
given that,
the theoretical probability of the event “flip heads” changes when a coin is flipped more times in an experiment.
so it is increased.
there are more chances for heads to be flipped.
so option A is correct.
In 2-4, use the information given. Brianna has a bag of marbles that are all the same size. Of all the marbles in the bag, there are 6 red, 7 white, 3 black, and 4 green marbles.
Question 2.
Select all the likelihood statements that are true. Lesson 7-1
☐ It is impossible that Brianna will draw a blue marble.
☐ It is more likely that Brianna will draw a black marble than a green marble.
☐ It is certain that Brianna will draw either a red, white, black, or green marble.
☐ It is unlikely that Brianna will draw a black marble.
☐ It is neither likely nor unlikely that Brianna will draw a green marble.
Answer:
Options C, D, and E are correct.
Explanation:
In the above-given question,
given that,
Brianna has a bag of marbles that are all the same size.
Of all the marbles in the bag, there are 6 red, 7 white, 3 black, and 4 green marbles.
it is certain that Brianna will draw either a red, white, black, or green marble.
it is unlikely that Brianna will draw a black marble.
it is neither likely nor unlikely that Brianna will draw a green marble.
so options C, D, and E are correct.
Question 3.
Ryan asks 80 people to choose a marble, note the color, and replace the marble in Brianna’s bag. The results of the random marble selections in this experiment are: 34 red, 18 white, 9 black, and 19 green marbles. How does the theoretical probability compare with the experimental probability of drawing a white marble? Lessons 7-2 and 7-3
Answer:
The theoretical probability is equal to the experimental probability.
Explanation:
In the above-given question,
given that,
Ryan asks 80 people to choose marble, note the color, and replace the marble in Brianna’s bag.
The results of the random marble selections in this experiment are 34 red, 18 white, 9 black, and 19 green marbles.
34 + 18 + 9 + 19 = 80.
p(white) = p(18/80).
p(white) = p(0.225).
so the theoretical probability is equal to the experimental probability.
Question 4.
Write a probability model for this experiment, and use the probability model to predict how many times Brianna would pick a green marble if she chose a marble 50 times. Give the probabilities as simplified fractions. Lesson 7-4
Drawing a red marble: __________
Drawing a black marble: __________
Drawing a white marble: __________
Drawing a green marble: __________
Brianna would draw __________ green marbles in 50 tries.
Answer:
Drawing red marble is p(25/50) = p(0.5).
Explanation:
In the above-given question,
given that,
Brianna would pick a green marble if she chose a marble 50 times.
34 – 9 = 25.
18 – 8 = 10.
9 – 4 = 5.
19 – 9 = 10.
drawing red marble is p(red) = p(25/50).
25/50 = 1/2.
so drawing red marble is p(0.5).
Question 5.
Jewel spins the pointer of a spinner. The spinner has 7 equal-sized sections labeled 1 to 7. What is the probability that Jewel will spin a 7? Lessons 7-2 and 7-4
Answer:
The probability that Jewel will spin a 7 is p(1).
Explanation:
In the above-given question,
given that,
Jewel spins the pointer of a spinner.
The spinner has 7 equal-sized sections labeled 1 to 7.
p(7/7) = p(1).
so the probability that Jewel will spin a 7 is p(1).
Topic 7 MID-TOPIC PERFORMANCE TASK
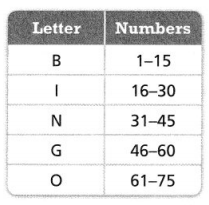
Viet, Quinn, and Lucy are going to play Bingo, using a standard game set. They make some predictions before the game begins. The table shows how the numbers match with the letters B, I, N, G, and O.
PART A
Viet makes a probability model to describe the probability of each number being called first. Quinn makes a probability model to describe the probability of any particular letter being called first. Compare the probability models.
Answer:
The probability models are (1/50), (16/30), (31/45), (46/60), and (61/75).
Explanation:
In the above-given question,
given that,
Viet, Quinn, and Lucy are going to play Bingo, using a standard game set.
B – 1 to 15.
I – 16 to 30.
N – 31 to 45.
G – 46 to 60.
O – 61 to 75.
so the probability models are 1/50), (16/30), (31/45), (46/60), and (61/75).
PART B
Lucy makes a probability model to determine whether the first number drawn will be even or odd. Compare the different probabilities.
Answer:
The first probability model is odd.
Explanation:
In the above-given question,
given that,
the first number drawn is odd.
1 – 15.
15/75.
so the first probability model is odd.
PART C
Suppose the game changed to have 90 numbers, instead of 75 numbers, matched with the letters B, I, N, G, and O. How would Viet’s, Quinn’s, and Lucy’s probability models change? Explain.
Answer:
Lucy’s probability model change is 21/90.
Explanation:
In the above-given question,
given that,
suppose the game changed to have 90 numbers., instead of 75 numbers.
so the B – 1 to 21.
I – 22 to 36.
N – 37 to 51.
G – 52 to 66.
O – 67 to 90.
so Lucy’s probability model change is 21/90.
3-Act Mathematical Modeling: Photo Finish
ACT 1
Question 1.
After watching the video, what is the first question that comes to mind?
Answer:
Question 2.
Write the Main Question you will answer.
Answer:
Question 3.
Construct Arguments Predict an answer to this Main Question. Explain your prediction.

Answer:
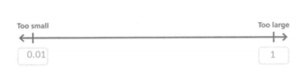
Question 4.
On the number line below, write a number that is too small to be the answer. Write a number that is too large. Plot your prediction on the same number line.
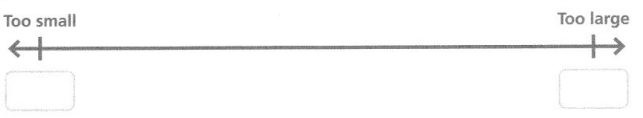
Answer:
The too small is 0.01 and the large is 1.
Explanation:
In the above-given question,
given that,
the number that is too small is 0.01.
it is the starting stage of the number line.
the number that is too large is 1.
it is the ending stage of the number line.
ACT 2
Question 5.
What information in this situation would be helpful to know? How would you use that information?

Answer:
Question 6.
Use Appropriate Tools What tools can you use to solve the problem? Explain how you would use them strategically.
Answer:
Question 7.
Model with Math Represent the situation using mathematics. Use your representation to answer the Main Question.
Answer:
Question 8.
What is your answer to the Main Question? Is it higher or lower than your prediction? Explain why.

Answer:
ACT 3
Question 9.
Write the answer you saw in the video.
Answer:
Question 10.
Reasoning Does your answer match the answer in the video?
If not, what are some reasons that would explain the difference?
Answer:
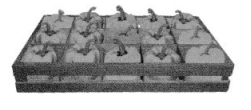
Question 11.
Make Sense and Persevere Would you change your model now that you know the answer? Explain.
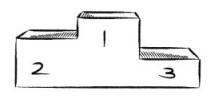
Answer:
The answer is 6.
Explanation:
In the above-given question,
given that,
the numbers on the figure are 1, 2, and 3.
1 + 2 + 3 = 6.
so the answer is 6.
ACT 3
Reflect
Question 12.
Model with Math Explain how you used a mathematical model to represent the situation. How did the model help you answer the Main Question?

Answer:
Question 13.
Be Precise What vocabulary have you learned in this topic that helps you communicate the answer to the Main Question?
Answer:
SEQUEL
Question 14.
Generalize How would your answer change if a fifth person joined the race? A sixth person? If n people are running in the race?
Answer:
Lesson 7.5 Determine Outcomes of Compound Events
Solve & Discuss It!
Cameron packed two pairs of shorts and three T-shirts for a weekend trip. What are some combinations of shirts and shorts that Cameron can wear while on his trip? How many days will he have a different outfit to wear?
I can… find all possible outcomes of a compound event.
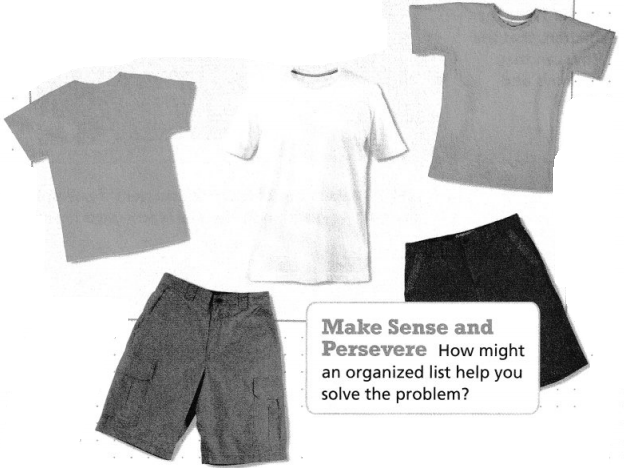
Focus on math practices
Reasoning How would the number of different outfits change if Cameron packed a pair of khaki shorts? Explain.
Essential Question
How can all the possible outcomes, or sample space, of a compound event be represented?
Answer:
The number of times the possible outcomes are 3.
Explanation:
In the above-given question,
given that,
Cameron can wear 3 t-shirts in 3 days.
Cameron packed two pairs of shorts and three T-shirts for a weekend trip.
Cameron can wear 3 t-shirts in 3 days.
so the number of times the possible outcomes are 3.
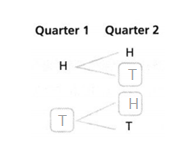
Try It!
Jorge will flip two quarters at the same time. Complete the tree diagram, and then list the sample space of this compound event. Use H for heads and T for tails.
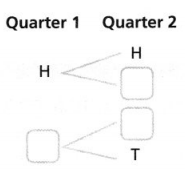
The sample space is:______________
Answer:
The missing numbers are H, H, and T.
Explanation:
In the above-given question,
given that,
Jorge will flip two quarters at the same time.
two heads give the answer head.
two tails give the answer head.
so the missing numbers are H, H, and T.
Convince Me! How does the sample space change when the number of quarters that Jorge flips is increased by 1?
Try It!
The bag contains tiles labeled with the letters A, B, and C. The box contains tiles labeled with the numbers 1, 2, and 3. June draws one letter tile and one number tile. Represent the sample space using either a table or an organized list.
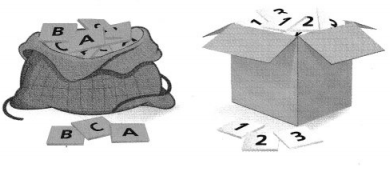
Answer:
The letter tiles are C/3 and 2/3.
Explanation:
In the above-given question,
given that,
The bag contains tiles labeled with the letters A, B, and C.
The box contains tiles labeled with the numbers 1, 2, and 3.
C/3 and 2/3.
so the letter tiles are C/3 and 2/3.
KEY CONCEPT
A compound event is a combination of two or more events.
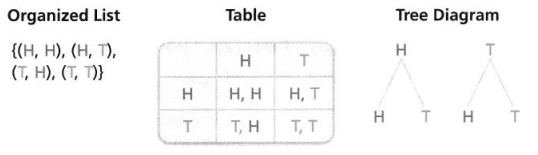
An organized list, table, or tree diagram can be used to represent the sample space of a compound event. The sample space for flipping two coins consists of 4 outcomes.
Do You Understand?
Question 1.
Essential Question How can all the possible outcomes, or sample space, of a compound event be represented?
Answer:
A compound event is a combination of two or more events.
Explanation:
In the above-given question,
given that,
two heads are equal to one tail.
one head and one tail are equal to head and tail.
two tails are equal to one head.
so compound event is a combination of two or more events.
Question 2.
Generalize Will a list, a table, and a tree diagram always give you the same number of outcomes for the same compound event? Explain.
Answer:
Yes, a table and a tree diagram always give the same number of outcomes.
Explanation:
In the above-given question,
given that,
two heads are equal to one tail.
one head and one tail are equal to head and tail.
two tails are equal to one head.
so the table and a tree diagram always give the same number of outcomes.
Question 3.
Use Structure Shari is drawing a tree diagram to represent the sample space of rolling a 12-sided game piece and spinning the pointer of a 4-section spinner. Does it matter if Shari starts the tree diagram with the game piece outcomes or the spinner outcomes? Explain.
Answer:
The game piece outcomes = 3.
Explanation:
In the above-given question,
given that,
Shari is drawing a tree diagram to represent the sample space of rolling a 12-sided game piece and spinning the pointer of a 4-section spinner.
12/4 = 3.
4 x 3 = 12.
so the game piece outcomes = 3.
Do You Know How?
Question 4.
Both Spinner A and Spinner B have equal-sized sections, as shown at the right. Make a table to represent the sample space when both spinners are spun.
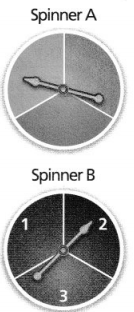
Answer:
The spinner A = 1, 2, and 3.
Explanation:
In the above-given question,
given that,
Both Spinner A and Spinner B have equal-sized sections, as shown on the right.
spinner B has the numbers 1, 2, and 3.
so the spinner A has 1, 2, and 3.
Question 5.
Tiles labeled with the letters X, Y, and Z are in a bag. Tiles labeled with the numbers 1 and 2 are in a box.
Make a tree diagram to represent the sample space of the compound event of selecting one tile from each container.
Answer:
Two x’s gives Y.
Two Y’s gives Z.
Explanation:
In the above-given question,
given that,
Tiles labeled with the letters X, Y, and Z are in a bag.
Tiles labeled with the numbers 1 and 2 are in a box.
1 – x, y, and z.
2 – x, y, and z.
so two x’s give y.
two y’s gives z.
Practice & Problem Solving
Leveled Practice In 6 and 7, find the number of outcomes for each event.
Question 6.
Oliver is playing a game in which he has to choose one of two numbers (2 or 7) and then one of five vowels (a, e, i, o, or u). How many possible outcomes are there?
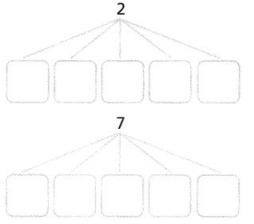
There are ________ possible outcomes.
Answer:
There are 7 possible outcomes.
Explanation:
In the above-given question,
given that,
Oliver is playing a game in which he has to choose one of two numbers (2 or 7).
and then one of five vowels (a, e, i, o, or u).
the events are 1/7, 2/7, 3/7, 4/7, 5/7, 6/7, and 1.
the vowels are a/7, e/7, i/7, o/7, and u/7.
so there are 7 possible outcomes.
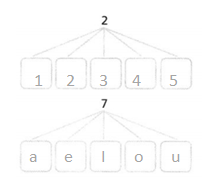
Question 7.
There are four stores that sell school supplies (S1, S2, S3, and S4) and three stores that sell sporting goods (G1, G2, and G3) nearby. How many possible combinations of stores could you visit to buy a tennis racquet and then a backpack?
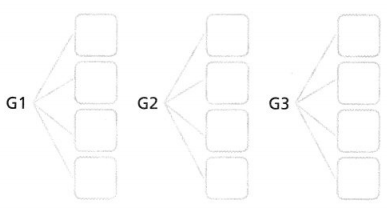
There are ________ possible combinations.
Answer:
There are 3 possible combinations.
Explanation:
In the above-given question,
given that,
There are four stores that sell school supplies (S1, S2, S3, and S4) and three stores.
that sell sporting goods (G1, G2, and G3) nearby.
G1 – s1, s2, s3, and s4.
G2 – s2, s3, s4, and s1.
G3 – s3, s4, s3, and s2.
so there are 3 possible combinations.
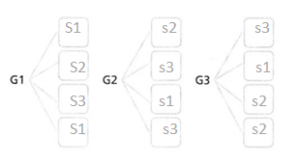
Question 8.
A bakery sells wheat, multigrain, rye, and oat bread. Each type of bread is available as a loaf or as dinner rolls.
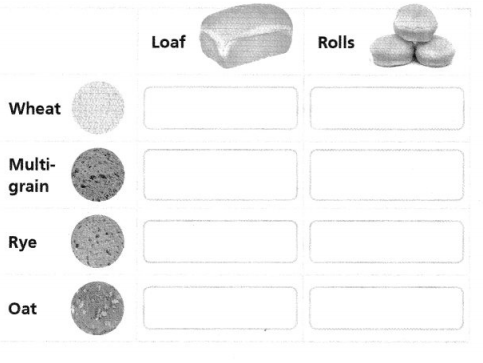
a. Complete the table to show all the possible outcomes for the types and styles of bread sold by the bakery.
Answer:
b. Find the number of possible outcomes.
Answer:
The number of possible outcomes is 8.
Explanation:
In the above-given question,
given that,
A bakery sells wheat, multigrain, rye, and oat bread.
wheat – 2 items.
multigrain – 2 items.
rye – 2 items.
oat bread – 2 items.
2 + 2 + 2 + 2 = 8.
so the number of possible outcomes is 8.
Question 9.
Generalize How does the number of possible outcomes of a single event help you determine the total number of possible outcomes of a compound event?
Answer:
A compound event is a combination of two or more events.
Explanation:
In the above-given question,
given that,
two heads are equal to one tail.
one head and one tail are equal to head and tail.
two tails are equal to one head.
so compound event is a combination of two or more events.
Question 10.
A new car can be purchased with a choice of four exterior colors (A, B, C, and D) and three interior colors (1, 2, and 3). Make an organized list of all the possible color combinations for the car.
Answer:
The organized list of all the possible color combinations for the car is 12.
Explanation:
In the above-given question,
given that,
A new car can be purchased with a choice of four exterior colors (A, B, C, and D).
and three interior colors (1, 2, and 3).
4 x 3 = 12.
1 – A, B, C, and D.
2 – B, C, D, and A.
3 – C, D, A, and B.
so the organized list of all the possible color combinations for the car is 12.
Question 11.
Two friends each plan to order a fruit drink at the diner. The available flavors are kiwi (K), lemon (L), and watermelon (W). Make a list to represent all the possible outcomes of the friends’ fruit drink order. Write each outcome in the format (Friend 1, Friend 2).

Answer:
Each outcome is in format 6.
Explanation:
In the above-given question,
given that,
Two friends each plan to order a fruit drink at the diner.
The available flavors are kiwi (K), lemon (L), and watermelon (W).
2 friends – 3 flavors.
3 x 2 = 6.
1 – K, L, and W.
2 – K, L, and W.
so the number of outcomes is 6.
Question 12.
Plastic souvenir cups come in three different sizes: small (S), medium (M), and large (L). The available colors are red (R), white (w), and blue (B). Make a list to represent all the possible combinations of the different cups based on size and color. Write each outcome in the format (Size, Color).
Answer:
The number of outcomes = 9.
Explanation:
In the above-given question,
given that,
Plastic souvenir cups come in three different sizes: small (S), medium (M), and large (L).
The available colors are red (R), white (w), and blue (B).
red – 3.
white – 3.
blue – 3.
3 + 3 + 3 = 9.
so the number of outcomes = 9.
Question 13.
Higher Order Thinking Heidi’s older sister needs to take either Chemistry (C), Geometry (G), or Physics (P) this year. She can take the class during any one of six periods (1 through 6). Is there more than one way to draw a tree diagram to model this situation? Explain.
Answer:
Yes, there is more than one way.
Explanation:
In the above-given question,
given that,
Heidi’s older sister needs to take either Chemistry (C), Geometry (G), or Physics (P) this year.
She can take the class during any one of six periods (1 through 6).
1 – 3.
2 – 3.
3 – 3.
4 – 3.
5 – 3.
6 – 3.
3 + 3 + 3 + 3 + 3 + 3 = 18.
so there is more than one way.
Assessment Practice
Question 14.
A fruit basket has 6 oranges, 4 apples and 2 pears in it. 5 people each select a piece of fruit and eat it. Which of the following outcomes could represent this selection?
☐ All 5 people eat an orange.
☐ 1 person eats an orange, 4 people eat an apple.
☐ 2 people eat an orange, 3 people eat a pear.
☐ 3 people eat an orange, 1 person eats an apple, 1 person eats a pear.
☐ All 5 people eat an apple.
Answer:
Options B, C, and D are correct.
Explanation:
In the above-given question,
given that,
A fruit basket has 6 oranges, 4 apples, and 2 pears in it.
5 people each select a piece of fruit and eat it.
6 + 4 + 2 = 12.
12/3 = 4.
so options B, C, and D are correct.
Question 15.
Royce has a collection of trading cards. 16 of his cards are baseball cards, 21 are football cards and 13 are basketball cards. He selects half of this collection and gives them to his friend. Which of the following represent possible outcomes of this selection?
☐ He gives his friend 6 baseball cards, 10 football cards and all of his basketball cards.
☐ He gives his friend 4 baseball cards and all of his football cards.
☐ He gives his friend only football cards.
☐ He gives his friend 8 baseball cards, 10 football cards and 7 basketball cards.
☐ He gives his friend all of his baseball and basketball cards.
Answer:
Options B, C, and D are correct.
Explanation:
In the above-given question,
given that,
Royce has a collection of trading cards.
16 of his cards are baseball cards, 21 are football cards and 13 are basketball cards.
16 + 21 + 13 = 50.
50/3 = 16.6.
so options B, C, and D are correct.
Lesson 7.6 Find Probabilities of Compound Events
Solve & Discuss It!
Talia is playing a game in which she must choose Option 1 or Option 2 and then spin the game wheel, flip the coin, and roll the number cube labeled 1 through 6. For her to win a prize, all the conditions listed under the chosen option must occur. Which option should Talia choose? Explain.
I can… find the probability of a compound event.
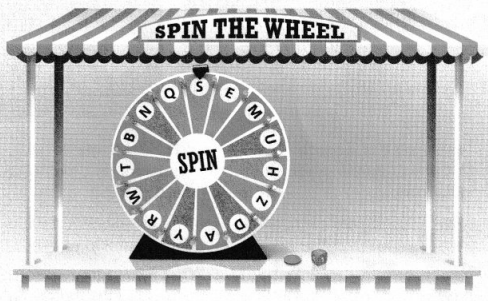
Option 1
• The game wheel lands on S.
• The coin lands on tails.
• An even number is rolled.
Option 2
• The game wheel lands on Z.
• The coin lands on either side.
• The number 3 is rolled.
Answer:
Both the options are correct.
Explanation:
In the above-given question,
given that,
in option 1 the game wheel lands on s.
the coil lands on tails.
an even number is rolled.
in option 2 the game wheel lands on z.
the coin lands on either side.
the number 3 is rolled.
so both the options are correct.
Look for Relationships
How can you use what you know about sample spaces to choose the best option?
Focus on math practices
Make Sense and Persevere Suppose an Option 3 was added to the game, with the conditions that the game wheel lands on Q, the coin lands on either side, and an odd number is rolled. Should Talia change her choice to Option 3? Explain.
Essential Question
How can a model help find the probability of a compound event?
Try It!
The designer of Flip ‘n’ Spin creates a new game using a 5-section spinner, as shown. How does the new spinner change the probability of winning a prize?
Using the 5-section spinner, the probability of winning a prize is ________ .
It is _________ likely that a player will win a prize when using the 5-section spinner than when using the 4-section spinner.
Answer:
It is more likely that a player will win a prize when using the 5-section spinner than when using the 4-section spinner.
Explanation:
In the above-given question,
given that,
The designer of Flip ‘n’ Spin creates a new game using a 5-section spinner, as shown.
if it is a 4-section spinner then it gives n/4.
if it is a 5 section spinner then it gives n/5.
so it is more likely that a player will win a prize when using the 5-section spinner than when using the 4-section spinner.
Convince Me! What generalization can you make about the number of sections on the spinner and the probability of winning a prize while playing the Flip ‘n’ Spin game?
Try It!
Is it more likely that a coin flipped 3 times will land heads up exactly once, or will land heads up exactly 2 twice? Explain using probability.
Answer:
Yes, two heads give tails and two tails give one head.
Explanation:
In the above-given question,
given that,
two heads give one tail.
two tails give one head.
so two heads give tails and two tails give one head.
Try It!
Does Marc have a greater chance than Carly of winning the tickets to Carly? Explain using probability.
Answer:
KEY CONCEPT
The probability of a compound event can be represented by a ratio of the number of favorable outcomes to the total number of possible equally likely outcomes. You can use an organized list, a table, or a tree diagram to determine the number of favorable outcomes and the total number of possible outcomes.
Do You Understand?
Question 1.
Essential Question How can a model help find the probability of a compound event?
Answer:
The probability of a compound event can be represented by a ratio of the number of favorable outcomes to the total number of possible equally likely outcomes.
Explanation:
In the above-given question,
given that,
The probability of a compound event can be represented by a ratio of the number of favorable outcomes to the total number of possible equally likely outcomes.
we can organize an organized list, a table, or a tree diagram to determine the number of favorable outcomes and the total number of possible outcomes.
Question 2.
Generalize What do you know about the outcomes of a compound event displayed in an organized list, a table, or a tree diagram?
Answer:
The probability of a compound event can be represented by a ratio of the number of favorable outcomes to the total number of possible equally likely outcomes.
Explanation:
In the above-given question,
given that,
The probability of a compound event can be represented by a ratio of the number of favorable outcomes to the total number of possible equally likely outcomes.
we can organize an organized list, a table, or a tree diagram to determine the number of favorable outcomes and the total number of possible outcomes.
Question 3.
How does finding the probability of a compound event compare with finding the probability of a simple event?
Answer:
The probability of a compound event can be represented by a ratio of the number of favorable outcomes to the total number of possible equally likely outcomes.
Explanation:
In the above-given question,
given that,
The probability of a compound event can be represented by a ratio of the number of favorable outcomes to the total number of possible equally likely outcomes.
we can organize an organized list, a table, or a tree diagram to determine the number of favorable outcomes and the total number of possible outcomes.
Do You Know How?
Question 4.
One of three contestants will be randomly selected to win a prize. One of three different prizes will be randomly awarded to the contestant whose name is selected to win. The tree diagram shows all possible outcomes of this contest.
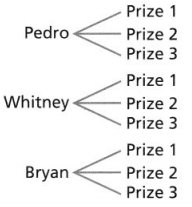
What is the probability that Whitney will win Prize 2?
Answer:
The probability that Whitney will win prize 2 is 3.
Explanation:
In the above-given question,
given that,
One of three contestants will be randomly selected to win a prize.
One of three different prizes will be randomly awarded to the contestant whose name is selected to win.
the contestants are Pedro, Whitney, and Bryan.
Pedro wins 3 prizes.
Whitney wins 3 prizes.
Bryan wins 3 prizes.
so the probability that Whitney will win prize 2 is 3.
Question 5.
The table shows all the possible outcomes for flipping a coin and spinning the pointer of a spinner with four equal-sized sections labeled 1 through 4.

a. What is the probability that the pointer will stop on 3 and the coin will land on heads?
Answer:
The probability that the pointer will stop on 3 and the coin will land on heads = 6.
Explanation:
In the above-given question,
given that,
there are two combinations.
they are heads and tails.
heads 1 = 1 + 1 = 2.
heads 2 = 2 + 2 = 4.
heads 3 = 3 + 3 = 6.
heads 4 = 4 + 4 = 8.
so the probability that the pointer will stop on 3 and the coin will land on heads = 6.
b. What is the probability that the pointer will stop on an odd number and the coin will land on heads?
Answer:
The probability that the pointer will stop on an odd number and the coin will land on heads = 3.
Explanation:
In the above-given question,
given that,
there are two combinations.
they are heads and tails.
heads 1 = 1 + 1 = 2.
heads 2 = 2 + 2 = 4.
heads 3 = 3 + 3 = 6.
heads 4 = 4 + 4 = 8.
Practice & Problem Solving
Multimedia Leveled Practice in 6 and 7, find the probability of each event.
Question 6.
A fair coin is tossed twice in succession. The sample space is shown, where H represents heads up and T represents tails up. Find the probability of getting exactly one tail.
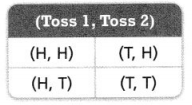
There are _________ outcomes that have exactly one tail. There are _________ possible outcomes, which are equally likely.
P(exactly one tail) = __________, or _________ %
Answer:
P(exactly one tail) = 2 or 2%.
Explanation:
In the above-given question,
given that,
A fair coin is tossed twice in succession.
The sample space is shown, where H represents heads up and T represents tails up.
toss1 and toss2.
in toss1 there are 2 heads, 2 tails.
p(exactly one tail) = 2 or 2%.
Question 7.
The tree diagram shows the sample space of two-digit numbers that can be created using the digits 2, 6, 7, and 9. What is the probability of choosing a number from the sample space that contains both 9 and 6?
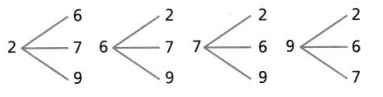
There are _________ outcomes that include both 9 and 6. There are _________ possible outcomes, which are equally likely
P(9 and 6) = __________, or __________ %
Answer:
The probability of choosing a number from the sample space that contains both 9 and 6 = 4.
Explanation:
In the above-given question,
given that,
The tree diagram shows the sample space of two-digit numbers that can be created using the digits 2, 6, 7, and 9.
the probability of choosing a number from the sample space that contains both 9 and 6:
in 1st diagram, there is 1 combination.
in the 2nd diagram, there is 1 combination.
in the 3rd diagram, there is 1 combination.
in the 4th diagram, there is 1 combination.
so the probability of choosing a number from the sample space that contains both 9 and 6 = 4.
Question 8.
The table shows the possible outcomes of spinning the given spinner and flipping a fair coin. Find the probability of the coin landing heads up and the pointer landing on either 1, 2, or 4.
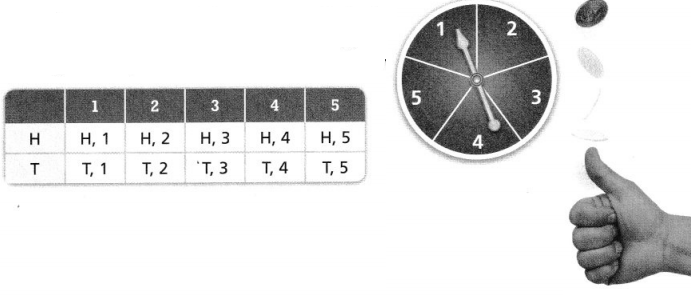
Answer:
The probability of the coin landing heads up and the pointer landing on 1.
Explanation:
In the above-given question,
given that,
The table shows the possible outcomes of spinning the given spinner and flipping a fair coin.
on coin 1 the pointer landing up.
so the probability of the coin landing heads up and the pointer landing on 1.
Question 9.
The organized list shows all the possible outcomes when three fair coins are flipped. The possible outcomes of each flip are heads (H) and tails (T). What is the probability that at least 2 fair coins land heads up when 3 are flipped?
Sample Space
HHT
HTH
HTT
THH
THT
ΤΤΗ
TTT
Answer:
HHT, HTH, THH.
Explanation:
In the above-given question,
given that,
The organized list shows all the possible outcomes when three fair coins are flipped.
The possible outcomes of each flip are heads (H) and tails (T).
HTH, HTH, and THH.
Question 10.
Look for Relationships Gary spins two game wheels at the carnival. He will win a prize if both of the wheels land on any red section. How does the chance of winning change if different game wheels are used with more sections that aren’t red?
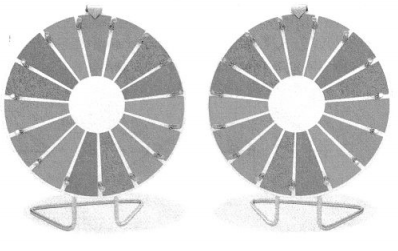
Answer:
Question 11.
Model with Math Each week, a clothing store gives away a shirt to a lucky customer. The shirts vary by sleeve type (Long, Short, No Sleeve) and color (Gray, Blue, Pink). Draw a tree diagram to represent the sample space. What is the probability that the free shirt will have either long or short sleeves and be either pink or blue?
Answer:
The probability that the free shirt will have either long or short sleeves and be either pink, blue, and gray.
Explanation:
In the above-given question,
given that,
Each week, a clothing store gives away a shirt to a lucky customer.
The shirts vary by sleeve type (Long, Short, No Sleeve) and color (Gray, Blue, Pink).
the gray color shirt has a sleeve type and no sleeve.
the blue color shirt has a sleeve type and no sleeve.
the pink color shirt has a sleeve type and no sleeve.
so the probability that the free shirt will have either long or short sleeves and be either pink, blue, and gray.
Question 12.
Higher Order Thinking The table shows the sample space of picking a 2-character password using the letters Y, B, R, O, G, and P. If double letters are not allowed, what is the probability of choosing a password with no Y’s? With no O’s? Is one probability greater than the other? Explain.
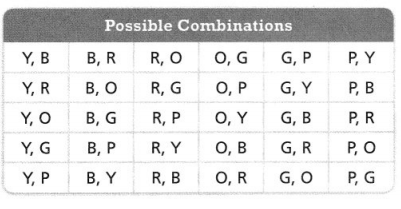
Answer:
The probability of choosing a password with no y’s = 20.
Explanation:
In the above-given question,
given that,
The table shows the sample space of picking a 2-character password using the letters Y, B, R, O, G, and P.
there is a number of possibilities of choosing a password with no y’s.
there is a number of possibilities of choosing a password with no o’s.
so the probability of choosing a password with no y’s = 20.
Assessment Practice
Question 13.
A single number cube is rolled twice.
PART A
Determine the number of possible outcomes. Explain how you know you have found all the possible outcomes.
PART B
Find the probability of rolling two numbers that have a sum equal to 10.
Answer:
Lesson 7.7 Simulate Compound Events
Solve & Discuss It!
Jillian lands the beanbag on the board in about half of her attempts in a beanbag toss game. How can she predict the number of times she will get the beanbag in the hole in her next 5 attempts using a coin toss?
I can… simulate a compound event to approximate its probability.
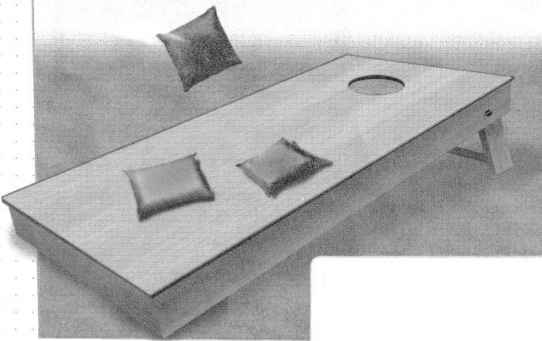
Make Sense and Persevere
How can you use what you know about the theoretical probability of landing heads-up or tails-up?
Focus on math practices
Use Appropriate Tools When might it be useful to model a scenario with a coin or other tool?
Essential Question
How can you use simulations to determine the probability of events?
Try It!
There is a 50% chance that a volleyball team will win any one of its four remaining games this year. A spinner with 2 equal sections numbered 1 (win) and 2 (loss) is used to simulate the probability that the team will win exactly two of its last four games. The results of the simulation are shown below.
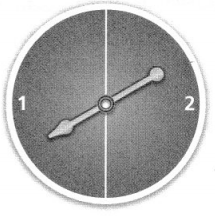
1221 1121 2211 2121 2221 2212 1122 1111 1222 1112
Out of 10 trials, there are _________ favorable outcomes. Based on the simulation, the probability that the team will win exactly 2 of its last 4 games is ____________.
Answer:
Out of 10 trials, there are 10 favorable outcomes.
Explanation:
In the above-given question,
given that,
There is a 50% chance that a volleyball team will win any one of its four remaining games this year.
A spinner with 2 equal sections numbered 1 (win) and 2 (loss).
1111 is the favorable outcome.
so out of 10 trials, there are 10 favorable outcomes.
Convince Me! Does the probability that the team will win two games change when “exactly” is replaced with “at least”? Explain.
Try It!
In a tennis tournament, 25% of Sarah’s serves were aces. Design a simulation to predict how many aces you expect Sarah to serve out of 50 serves.
Answer:
The number of aces we expect Sarah to serve out of 50 serves = 2%.
Explanation:
In the above-given question,
given that,
In a tennis tournament, 25% of Sarah’s serves were aces.
50/25 = 2.
so the number of aces we expect Sarah to serve out of 50 serves = 2%.
KEY CONCEPT
A simulation is a model of a real-world situation that can be used to predict results or outcomes when the actual event is difficult to perform or record.
A simulation uses a tool, such as a spinner, number cube, coin, or random number generator, for which outcomes have the same probabilities as the actual event.
A greater number of trials will usually give results that are closer to the theoretical probability of the actual event.
Do You Understand?
Question 1.
Essential Question How can you use simulations to determine the probability of events?
Answer:
The simulation is a model of a real-world situation that can be used to predict results or outcomes when the actual event is difficult to perform or record.
Explanation:
In the above-given question,
given that,
A simulation uses a tool, such as a spinner, number cube, coin, or random number generator, for which outcomes have the same probabilities as the actual event.
A greater number of trials will usually give results that are closer to the theoretical probability of the actual event.
so simulation is a model of a real-world situation that can be used to predict results or outcomes when the actual event is difficult to perform or record.
Question 2.
Look for Relationships What is the connection between the tool used to simulate an event and the probability of the actual event?
Answer:
The simulation is a model of a real-world situation that can be used to predict results or outcomes when the actual event is difficult to perform or record.
Explanation:
In the above-given question,
given that,
A simulation uses a tool, such as a spinner, number cube, coin, or random number generator, for which outcomes have the same probabilities as the actual event.
A greater number of trials will usually give results that are closer to the theoretical probability of the actual event.
so simulation is a model of a real-world situation that can be used to predict results or outcomes when the actual event is difficult to perform or record.
Question 3.
Why are the results of simulations usually close to the probabilities of their related events?
Answer:
The simulation is a model of a real-world situation that can be used to predict results or outcomes when the actual event is difficult to perform or record.
Explanation:
In the above-given question,
given that,
A simulation uses a tool, such as a spinner, number cube, coin, or random number generator, for which outcomes have the same probabilities as the actual event.
A greater number of trials will usually give results that are closer to the theoretical probability of the actual event.
so simulation is a model of a real-world situation that can be used to predict results or outcomes when the actual event is difficult to perform or record.
Do You Know How?
Question 4.
Carl hits the target 50% of the time he throws a ball at it. Carl uses a coin to simulate his next three pitches. He assigns H for a hit and T for a miss. The results of 12 trials are shown below.
HHT HTH TTH HTT THT THH
HHT HTT HTH HTT TTH THT
Based on the results, what is the probability that Carl will hit the target with exactly two of his next three throws?
Answer:
The probability that carl will hit the target with exactly two of his next three throws = TTH and HHT.
Explanation:
In the above-given question,
given that,
Carl hits the target 50% of the time he throws a ball at it.
Carl uses a coin to simulate his next three pitches.
He assigns H for a hit and T for a miss.
the missing trials are TTH and HHT.
Question 5.
On average, Margo scores a goal for her field hockey team every 2 out of 3 shots. Margo uses a number cube to simulate her next three shots. She assigns 1 to 4 as “goals” and 5 and 6 as “missed shots.” Why does this assignment of numbers on the number cube make it a valid simulation?
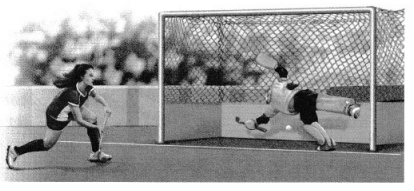
Answer:
Yes, it is a valid simulation.
Explanation:
In the above-given question,
given that,
On average, Margo scores a goal for her field hockey team every 2 out of 3 shots.
Margo uses a number cube to simulate her next three shots.
She assigns 1 to 4 as “goals” and 5 and 6 as “missed shots.
so it is a valid simulation.
Practice & Problem Solving
Leveled Practice In 6 and 7, estimate the probability for each event.
Question 6.
Molly makes 70% of her free throws. The random numbers below represent 20 trials of a simulation of two free throws, using the numbers 0 through 9.
Let the numbers from ![]() to
to ![]() represent successful free throw.
represent successful free throw.
Let the number
Let the numbers from ![]() to
to ![]() represent a missed free throw.
represent a missed free throw.
Based on the simulated results, the probability that Molly makes both free throws is
Answer:
The numbers from 3 to 21 represent a successful free throw.
The numbers from 27 to 93 represent missed free throws.
Explanation:
In the above-given question,
given that,
Molly makes 70% of her free throws.
The random numbers below represent 20 trials of a simulation of two free throws, using the numbers 0 through 9.
the numbers are 38, 38, 21, 50, 64, 71, 80, 87, 66, 92, 89, 42, 29, 89, 47, 98, 93, 90, 27, and 3.
so the numbers from 3 to 21 represent successful free throws.
the numbers from 27 to 93 represent missed free throws.
Question 7.
Survey results state that 80% of people enjoy going to the beach. The random numbers below represent 10 trials of a simulation of asking two people if they enjoy going to the beach, using the numbers 0 through 9 for their responses.
Let the numbers from ![]() to
to ![]() represent people who enjoy going to the beach.
represent people who enjoy going to the beach.
Let the numbers from ![]() to
to ![]() represent people who do not enjoy going to the beach.
represent people who do not enjoy going to the beach.
Based on the simulated results, the probability that exactly one of two people enjoys going to the beach is ![]() , or
, or ![]() %.
%.
Answer:
The probability that exactly one of two people enjoys going to the beach is 80%.
Explanation:
In the above-given question,
given that,
Survey results state that 80% of people enjoy going to the beach.
the numbers are 86, 53, 54, 07, 22, 65, 9, 56, 40, and 15.
the numbers from 65 to 86 represent people who enjoy going to the beach.
the numbers from 7 to 56 represent people who do not enjoy going to the beach.
Question 8.
In Stacia’s town, 60% of registered people vote regularly. A spinner with equal-sized sections numbered 0 to 9 can be used to represent those who do and do not vote.
a. What numbers can be assigned to represent those who do vote and those who do not vote?
b. Based on the simulated results below, what is the probability that at least one person out of three does not vote?
Answer:
The numbers 799 and 851 do not vote.
the numbers 117 to 768 do not vote.
Explanation:
In the above-given question,
given that,
In Stacia’s town, 60% of registered people vote regularly.
A spinner with equal-sized sections numbered 0 to 9 can be used to represent those who do and do not vote.
the numbers are 380, 799, 331, 205, 851, 182, 117, 768, 715 and 410.
the numbers 799 and 851 do not vote.
the numbers 117 to 768 do not vote.
Question 9.
Inspection of items at a company shows that an item has a 50% chance of being defective. A spinner with equal-sized sections numbered 0 to 9 can be used to simulate the event that the next 2 items inspected are defective.
a. How would you assign numbers to represent the defective and non-defective items?
b. Based on the simulated results below, what is the probability that the next 2 items are defective?
Answer:
Question 10.
Julie used a number cube to simulate a flower seed sprouting, for which the success rate is 50%. She used even numbers to represent success and odd numbers to represent failure. The results of 8 trials that simulate the sprouting of five seeds are shown below.
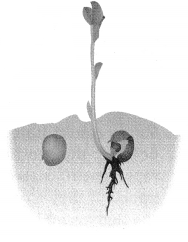
Based on the simulated results, what is the probability that none of the next five flower seeds will sprout successfully?
Answer:
The next five flower seeds will sprout successfully is 43631, 25143, 25643, and 64133.
Explanation:
In the above-given question,
given that,
Julie used a number cube to simulate a flower seed sprouting, for which the success rate is 50%.
She used even numbers to represent success and odd numbers to represent failure.
the given numbers are 31534, 35635, 43631, 35633, 25143, 25643, 64133, and 53113.
so the next five flower seeds will sprout successfully is 43631, 25143, 25643, 64133.
Question 11.
Construct Arguments How is the difference between the simulated probability and the theoretical probability of an actual event related to the number of simulated trials conducted?
Answer:
Question 12.
Higher Order Thinking Suppose Arun has an 80% chance of winning a game. For a simulation, the numbers 0 to 7 represent winning, and the numbers 8 and 9 represent losing. Write three different trial results that show 5 wins in a row out of 6 games played.
Answer:
The numbers are 1, 2, 3, 4, 5, and 6.
Explanation:
In the above-given question,
given that,
Arun has an 80% chance of winning a game.
For a simulation, the numbers 0 to 7 represent winning, and the numbers 8 and 9 represent losing.
3, 4, 5, 6, 7.
1, 2, 3, 4, 5.
2, 3, 4, 5, 6.
so the numbers are 1, 2, 3, 4, 5, and 6.
Assessment Practice
Question 13.
About 50% of the people surveyed in a certain county work for a small business. A random number generator was used to simulate the results of the next four people surveyed.
The numbers 0 to 4 represent people who work for a small business, and the numbers 5 to 9 represent people who do not work for a small business.
Answer:
The numbers who work for a small business are 0501, 0403, 3074, 2235, 0803, 3750, 1288, 3154.
the numbers who do not work for a small business are 6411, 7582, 7383, 5250, 7694, 9225, 7121, 7596, 8223, 8121, and 7652.
Explanation:
In the above-given question,
given that,
About 50% of the people surveyed in a certain county work for a small business.
A random number generator was used to simulate the results of the next four people surveyed.
The numbers 0 to 4 represent people who work for a small business, and the numbers 5 to 9 represent people who do not work for a small business.
so the numbers who work for a small business are 0501, 0403, 3074, 2235, 0803, 3750, 1288, 3154.
the numbers who do not work for a small business are 6411, 7582, 7383, 5250, 7694, 9225, 7121, 7596, 8223, 8121, and 7652.
PART A
Based on the simulated results shown above, what is the probability that at least one of the next four people surveyed works for a small business?
Answer:
The people who surveyed works for a small business = 5250.
Explanation:
In the above-given question,
given that,
About 50% of the people surveyed in a certain county work for a small business.
A random number generator was used to simulate the results of the next four people surveyed.
The numbers 0 to 4 represent people who work for a small business, and the numbers 5 to 9 represent people who do not work for a small business.
so the people who surveyed works for a small business = 5250.
PART B
How would the design of the simulation change if the percent of people who work for a small business was 70%?
Answer:
The number of people who work for a small business was 70% is 6411, 7582, 7383, 5250, 7694, 9225, 7121, 7596, 8223, 8121, and 7652.
Explanation:
In the above-given question,
given that,
About 70% of the people surveyed in a certain county work for a small business.
A random number generator was used to simulate the results of the next four people surveyed.
The numbers 0 to 4 represent people who work for a small business, and the numbers 5 to 9 represent people who do not work for a small business.
so the people who work for a small business were 6411, 7582, 7383, 5250, 7694, 9225, 7121, 7596, 8223, 8121, and 7652.
Topic 7 REVIEW
Topic Essential Question
How can you investigate chance processes and develop, use, and evaluate probability models?
Vocabulary Review
Complete each definition, and then provide an example of each vocabulary word.

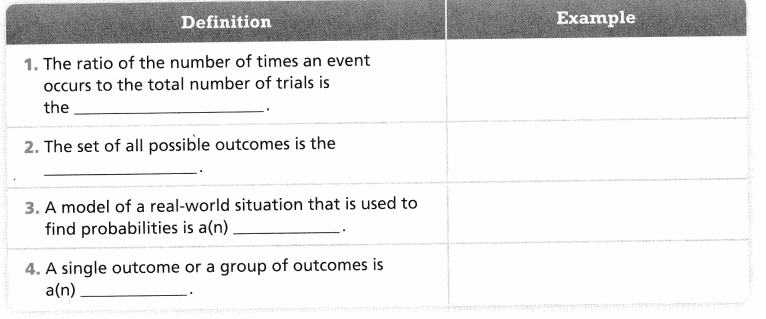
Answer:
The ratio of the number of times an event occurs to the total number of trials is the probability.
the set of all possible outcomes is the sample space.
a model of a real-world situation that is used to find probabilities is a(n) is simulation.
a single outcome or a group of outcomes is a(n) is an elementary event.
Explanation:
In the above-given question,
given that,
The ratio of the number of times an event occurs to the total number of trials is the probability.
for example:
p(red) = 7/12.
the set of all possible outcomes is the sample space.
for example:
if the set is finite = {H, T}.
a model of a real-world situation that is used to find probabilities is a(n) is simulation.
for example:
dice.
a single outcome or a group of outcomes is a(n) is an elementary event.
for example:
sample space for a pair of dice.
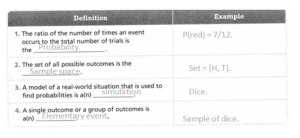
Use Vocabulary in Writing
A restaurant serves either skim milk or whole milk in glasses that are either small, medium, or large. Use vocabulary words to explain how you could determine all the possible outcomes of milk choices at the restaurant. Use vocabulary words in your explanation.
Concepts and Skills Review
Lesson 7.1 Understand Likelihood and Probability
Quick Review
The probability of an event describes the likelihood an event will occur. The likelihood of an event ranges from impossible to certain, but more common descriptions are likely or unlikely. An event is a single outcome or group of outcomes. An outcome is a possible result of an action. Probability can be represented as a fraction, as a decimal, or as a percent. Something is fair if there is an equal chance for each outcome to occur.
Practice
Question 1.
Use Luke’s 10-sided solid from the example. Describe an event that is certain and one that is impossible using this solid.
Answer:
The event describes the likelihood an event will occur.
Explanation:
In the above-given question,
given that,
Luke’s 10-sided solid from the example.
the event describes the likelihood an event will occur.
Question 2.
A spinner with 8 equal-sized sections is used for a game. Based on the descriptions below, is the spinner fair? Explain. The probability the pointer will land on yellow is 1 out of 4.
The probability the pointer will land on blue is 2 out of 8.
The probabilities that the pointer will land on green or red are both 25%.
Answer:
Yes, the spinner is fair.
Explanation:
In the above-given question,
given that,
A spinner with 8 equal-sized sections is used for a game.
the probability the pointer will land on blue is 2 out of 8.
the probability the pointer will land on yellow is 1 out of 4.
2/8 = 1/4.
so the spinner is fair.
Lesson 7.2 Understand Theoretical Probability
Quick Review
The theoretical probability of an event can be found if the possible outcomes are known and are all equally likely. Theoretical probability can be used to make predictions.
Practice
Question 1.
Using the example, fifteen people take out a slip of paper from the bucket without looking and record the results before replacing the slip back into the bucket. How many times is a slip labeled “5” expected to be drawn?
Answer:
The number of times is a slip labeled 5 is 3.
Explanation:
In the above-given question,
given that,
fifteen people take out a slip of paper from the bucket without looking.
15/3 = 5.
so the number of times is a slip labeled 5 is 3.
Lesson 7.3 Understand Experimental Probability
Quick Review
The experimental probability or relative frequency is based on actual results from an experiment and may differ from the theoretical probability of an event occurring. This discrepancy decreases as the number of trials of an experiment increases. You can use experimental probability and proportional reasoning to make predictions.

Practice
Question 1.
Jaylon and Paula spin the pointer 30 times and get the results shown in the table.
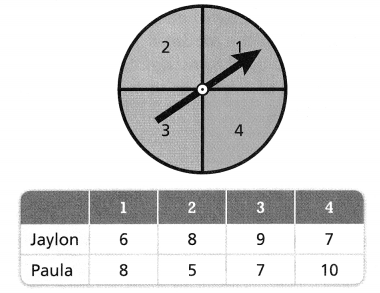
What is the theoretical probability of the pointer landing on the number 2?
Based on the results in the table, how does the experimental probability of the pointer landing on 2 compare to the theoretical probability?
Answer:
The theoretical probability of the pointer landing on the number 2 is 13.
the experimental probability of the pointer landing on the number 2 is 13.
Explanation:
In the above-given question,
given that,
Jaylon and Paula spin the pointer 30 times and get the results shown in the table.
Jaylon gets in 1st spin 6.
2nd spin 8, 3rd spin 9, and 4th spin 7.
Paula gets in 1st spin 8, 2nd spin is 5, 3rd spin is 7, and 4th spin is 10.
Question 2.
Based on the results in the table, about how many times should Jaylon and Paula expect the pointer to land on 4 out of a total of 130 spins? Explain your answer.
Answer:
The pointer to land on 4 out of a total of 130 is 0.30.
Explanation:
In the above-given question,
given that,
Jaylon and Paula expect the pointer to land on 4 out of a total of 130 spins.
4/130 = 0.30.
so the pointer to land on 4 out of a total of 130 is 0.30.
Lesson 7.4 Use Probability Models
Quick Review
A probability model consists of a sample space, or all possible outcomes of an action, and a list of events within the sample space with the probability of each. The sum of the probabilities in the model is 1. A probability model can be used to make conclusions about probabilities of events or to make estimates or predictions.
Practice
Question 1.
Abe has a different spinner. He also wants to develop a probability model.
How will his probability model be the same as, and how will it differ from, Jenna’s model?
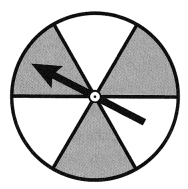
Question 2.
Walter has a different spinner.
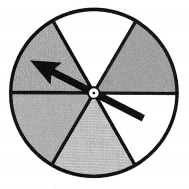
What is the probability that the pointer will land on a color that is not red?
Answer:
Question 3.
What is the sample space of Walter’s spinner?
Answer:
Question 4.
Walter will spin the pointer 50 times. About how many times will the pointer land on each color?
Answer:
Lesson 7.5 Determine Outcomes of Compound Events
Quick Review
A compound event is a combination of two or more events. An organized list, table, or tree diagram can be used to represent the sample space of a compound event.
Practice
Question 1.
A basket contains a red, a yellow, and a green apple. A second basket contains an orange, a lemon, and a peach. Use an organized list to show all the outcomes in the sample space.
Answer:
The organized list to show all the outcomes in the sample space is 1.
Explanation:
In the above-given question,
given that,
A basket contains a red, a yellow, and a green apple.
A second basket contains an orange, a lemon, and a peach.
p(3/3) = 1.
so the organized list to show all the outcomes in the sample space is 1.
Question 2.
Simon is playing a game with letter tiles. He has 5 tiles remaining and will spell a new word by placing two tiles-first a consonant and then a vowel-in front of a Y already on the board. Complete the table below to describe all combinations of tiles that Simon can use to spell a new word.
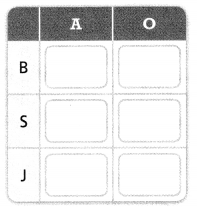
Lesson 7.6 Find Probabilities of Compound Events
Quick Review
The probability of a compound event can be represented by a ratio of the favorable outcomes to all possible outcomes. The probability can be calculated using an organized list, a table, or a tree diagram.
Practice
Question 1.
One set of cards has a beach, a road, a desert, a mountain, and an island. A second set of cards has a car, a truck, and a van. Complete the table below to find the probability of randomly drawing a mountain card and a truck card.

Answer:
Beach = 1, 2, and 3.
Road = 4, 5, and 6.
Desert = 7, 8, and 9.
Mountain = 10, 11, and 12.
Island = 13, 14, and 15.
Explanation:
In the above-given question,
given that,
One set of cards has a beach, a road, a desert, a mountain, and an island.
The second set of cards has a car, a truck, and a van.
Beach = 1, 2, and 3.
Road = 4, 5, and 6.
Desert = 7, 8, and 9.
Mountain = 10, 11, and 12.
Island = 13, 14, and 15.
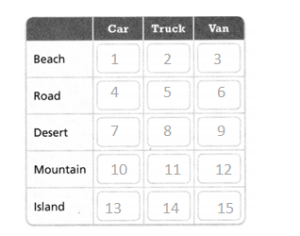
Lesson 7.7 Simulate Compound Events
Quick Review
An actual event is sometimes difficult to perform or record. A simulation can be used to model the outcomes of a real-world event. Based on simulated results, you can approximate the probability and predict the future outcomes of an event.
Practice
Question 1.
Felix’s favorite cereal includes 1 of 3 different prizes inside each box. The chance of getting each prize is equally likely. Felix conducts a simulation to see what his chances are of collecting all 3 prizes if he buys 5 boxes over time. Each section of the spinner represents the possible prizes in a single box.
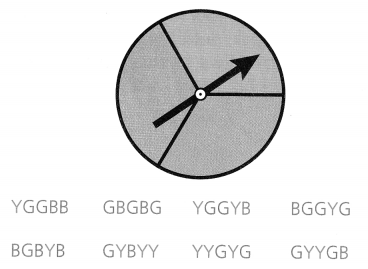
Based on the simulation, what is the probability that Felix will collect all three prizes?
Answer:
The spinner represents the possible prizes in a single box = GBGBG, BGGYG, BGBYB, GYBYY, and YYGYG.
Explanation:
In the above-given question,
given that,
Felix’s favorite cereal includes 1 of 3 different prizes inside each box.
The chance of getting each prize is equally likely.
Felix conducts a simulation to see what his chances are of collecting all 3 prizes if he buys 5 boxes over time.
The spinner represents the possible prizes in a single box = GBGBG, BGGYG, BGBYB, GYBYY, and YYGYG.
Question 2.
Reece is playing a carnival game in which he must guess under which of 2 cups a ball is hidden. To simulate the results of this game, he flips a coin with heads up (H) representing wins and tails up (T) representing losses. Based on the simulation below, what is the probability that Reece will win at least 2 of his next 4 games?

Answer:
The probability of representing the win of games is p(2) are HHTH and HHHT.
Explanation:
In the above-given question,
given that,
Reece is playing a carnival game in which he must guess under which of 2 cups a ball is hidden.
to simulate the results of this game, he flips a coin with heads up(H) representing wins and tails up(T) representing losses.
HH HT and HHTH represent the win of games.
so the probability of representing the win of games is p(2).
Topic 7 Fluency Practice
Hidden Clue
For each ordered pair, one coordinate is given. Find the second coordinate by determining the sale price after the percent markup or markdown. Then locate and label the corresponding point on the graph. Draw line segments to connect the points in alphabetical order. Use the completed picture to help you answer the riddle below.
A (13, 25% markup on $4). 13, ![]()
B (30% markdown on $10, 1) ![]() , 1
, 1
C (20% markdown on $1.25, 5) ![]() , 5
, 5
D (6, 40% markdown on $5.10) 6, ![]()
E (35% markup on $4, 9) ![]() , 9
, 9
F (4, 50% markdown on $18.50) 4, ![]()
G (60% markup on $2.50, 11) ![]() , 11
, 11
H (6, 25% markdown on $15) 6, ![]()
I (60% markup on $4, 13) ![]() , 13
, 13
J (8, 30% markdown on $18) 8, ![]()
K (50% markup on $5.30, 11) ![]() , 11
, 11
L (10,45% markdown on $20) 10, ![]()
M (35% markup on $7.60, 9) ![]() , 9
, 9
N (8, 30% markdown on $13) 8, ![]()
Answer:
A.13, 1.
B. 30, 1.
C. 0.25, 5.
D. 2.04, 6.
E. 1.4, 9.
F. 9.25, 4.
G. 1.5, 11.
H. 3.75, 6.
I. 2.4, 13.
J. 5.4, 8.
K. 2.65, 11.
L. 9, 10.
M. 2.66, 9.
N. 3.9, 8.
Explanation:
In the above-given question,
given that,
25/100 = 0.25 x 4 = 1.
30/100 = 0.3 x 10 = 3.
20/100 = 0.2 x 1.25 = 0.25.
40/100 = 0.4 x 5.10 = 2.04.
35/100 = 0.35 x 4 = 1.4.
50/100 = 0.5 x 18.50 = 9.25.
60/100 = 0.6 x 2.50 = 1.5.
25/100 = 0.25 x 15 = 3.75.
60/100 = 0.6 x 4 = 2.4.
30/100 = 0.3 x 5.18 = 5.4.
50/100 = 0.5 x 5.30 = 2.65.
45/100 = 0.4 x 20 = 8.
35/100 = 0.35 x 7.60 = 2.66.