Go through the enVision Math Common Core Grade 5 Answer Key Topic 10 Represent and Interpret Data and finish your homework or assignments.
enVision Math Common Core 5th Grade Answers Key Topic 10 Represent and Interpret Data

enVision STEM Project: Wildfires
Do Research Use the Internet and other sources to learn more about wildfires. Investigate how wildfires affect ecosystems. Explore the costs and benefits of wildfires. List five living things in an ecosystem. Research how long each one takes to recover from a wildfire.
Journal: Write a Report Include what you found. Also in your report:
• Make a pamphlet to show how wildfires affect ecosystems.
• Suggest ways to prevent wildfires.
• Make a line plot to show your data.
• Make up and solve problems using line plots.
Review What You Know
A-Z Vocabulary
Choose the best term from the Word List. Write it on the blank.
• bar graph
• overestimate
• compare
• frequency table
• underestimate
Question 1.
A display that shows how many times an event occurs is a(n) ____
Answer:
A display that shows how many times an event occurs is a frequency table.
Question 2.
A display that uses bars to show data is a(n) ____
Answer:
A display that uses bars to show data is a bar graph.
Question 3.
Rounding each factor in a multiplication to a greater number gives a(n) ____ of the actual product.
Answer:
Rounding each factor in multiplication to a greater number gives a overestimate of the actual product.
Question 4.
You can use the length of the bars in a bar graph to ___ two similar data sets.
Answer:
You can use the length of the bars in a bar graph to compare two similar data sets.
Fraction Computation
Find each answer.
Question 5.
2\(\frac{1}{2}\) + 5\(\frac{1}{3}\)
Answer:
2\(\frac{1}{2}\) + 5\(\frac{1}{3}\) = 7\(\frac{5}{6}\).
Explanation:
The addition of 2\(\frac{1}{2}\) + 5\(\frac{1}{3}\) is \(\frac{5}{2}\) + \(\frac{16}{3}\) which is \(\frac{15+32}{6}\) = \(\frac{47}{6}\) = 7\(\frac{5}{6}\).
Question 6.
13\(\frac{3}{10}\) – 8\(\frac{1}{5}\)
Answer:
13\(\frac{3}{10}\) – 8\(\frac{1}{5}\) = 5\(\frac{1}{10}\).
Explanation:
The subtraction of 13\(\frac{3}{10}\) – 8\(\frac{1}{5}\) is \(\frac{133}{10}\) – \(\frac{41}{5}\) which is \(\frac{133 – 82}{10}\) = \(\frac{51}{10}\) = 5\(\frac{1}{10}\).
Question 7.
8\(\frac{1}{3}\) + 7\(\frac{11}{12}\)
Answer:
8\(\frac{1}{3}\) + 7\(\frac{11}{12}\) = 15\(\frac{11}{12}\).
Explanation:
The addition of 8\(\frac{1}{3}\) + 7\(\frac{11}{12}\) is \(\frac{24}{3}\) + \(\frac{95}{12}\) which is \(\frac{96+95}{12}\)
= \(\frac{191}{12}\)
= 15\(\frac{11}{12}\).
Question 8.
15 – 5\(\frac{2}{9}\)
Answer:
15 – 5\(\frac{2}{9}\) = 9\(\frac{2}{9}\).
Explanation:
The subtraction of 15 – 5\(\frac{2}{9}\) is 15 – \(\frac{47}{9}\)
= \(\frac{135 – 47}{9}\)
= \(\frac{88}{9}\)
= 9\(\frac{2}{9}\).
Question 9.
7\(\frac{5}{8}\) + 13\(\frac{11}{20}\)
Answer:
7\(\frac{5}{8}\) + 13\(\frac{11}{20}\) = 21\(\frac{7}{40}\).
Explanation:
The addition of 7\(\frac{5}{8}\) + 13\(\frac{11}{20}\) is \(\frac{61}{8}\) + \(\frac{271}{20}\) = \(\frac{305+542}{40}\)
= \(\frac{847}{40}\)
= 21\(\frac{7}{40}\).
Question 10.
15\(\frac{4}{5}\) + 1\(\frac{2}{3}\)
Answer:
15\(\frac{4}{5}\) + 1\(\frac{2}{3}\) = 17\(\frac{7}{15}\).
Explanation:
The addition of 15\(\frac{4}{5}\) + 1\(\frac{2}{3}\) is \(\frac{79}{5}\) + \(\frac{5}{3}\) which is \(\frac{237+25}{15}\)
= \(\frac{262}{15}\)
= 17\(\frac{7}{15}\).
Question 11.
\(\frac{7}{8}\) × 4
Answer:
\(\frac{7}{8}\) × 4 = 7\(\frac{1}{2}\).
Explanation:
The multiplication of \(\frac{7}{8}\) × 4 which is \(\frac{7}{2}\)
= 7\(\frac{1}{2}\).
Question 12.
5 × 1\(\frac{2}{3}\)
Answer:
5 × 1\(\frac{2}{3}\) = 18\(\frac{1}{3}\).
Explanation:
The multiplication of 5 × 1\(\frac{2}{3}\) is 5 × \(\frac{11}{3}\)
= \(\frac{55}{3}\)
= 18\(\frac{1}{3}\).
Question 13.
2\(\frac{1}{8}\) × \(\frac{2}{3}\)
Answer:
2\(\frac{1}{8}\) × \(\frac{2}{3}\) = \(\frac{17}{12}\).
Explanation:
The multiplication of 2\(\frac{1}{8}\) × \(\frac{2}{3}\) is \(\frac{17}{8}\) × \(\frac{2}{3}\) which is \(\frac{17}{12}\).
Bar Graphs
Use the bar graph to answer the questions.
Question 14.
Which animal has about 34 teeth?
Answer:
Hyena.
Explanation:
The animal that has about 34 teeth is Hyena.
Question 15.
About how many more teeth does a dog have than a hyena?
Answer:
The number of many more teeth does a dog has is 8 teeth.
Explanation:
Here, the dog has 42 teeth and a hyena has 34 teeth. So the number of many more teeth does a dog has is 42 – 34 which is 8 teeth.
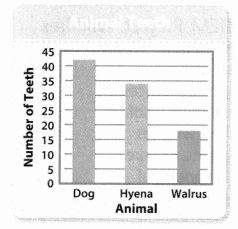
Question 16.
About how many more teeth does a hyena have than a walrus?
Answer:
The number of many more teeth does a hyena has is 15 teeth.
Explanation:
Here, a hyena has 32 teeth and a walrus has 17 teeth. So the number of many more teeth does a hyena has is 32 – 17 which is 15 teeth.
Pick a Project
PROJECT 10A
How big is Big Data?
Project: Make Line Plots for Data

PROJECT 10B
What was the first U.S. penny?
Project: Design a Coin

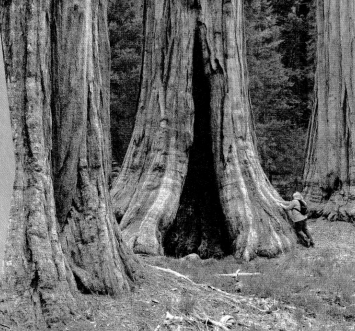
PROJECT 10C
Why are sequoia trees so big?
Project: Measure Trees
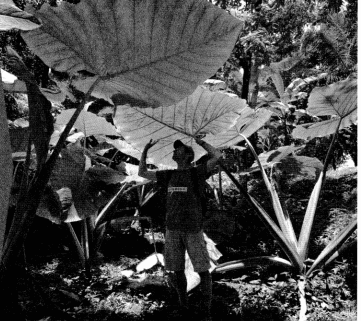
PROJECT 10D
How are plant leaves different?
Project: Make a Leafy Line Plot
Lesson 10.1 Analyze Line Plots
Solve & Share
Several students were asked how many blocks they walk from home to school each day. The results are shown in the line plot below. Miguel walks the shortest distance. Jila walks the longest distance. How much farther than Miguel does Jila walk?
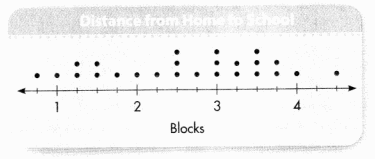
Answer:
Miguel walks 4.25 blocks more than Jila.
Explanation:
Here, the line plot is shown in the question which represents the distance traveled by the students from their houses to their school. So the distance between 1 and 2 is \(\frac{1}{4}\) which is 0.25 blocks. So the shortest distance traveled by Miguel is 0.25 blocks. And the longest distance traveled by Jila is 4.5 blocks. So the difference between the distances covered by Miguel and Jila is 4.5 – 0.25 = 4.25 blocks. So Miguel walks 4.25 blocks more than Jila.
Make Sense and Persevere How can you find the shortest distance walked?
Look Back! What can you tell about the distance most of the students in the group walk to school each day?
Visual Learning Bridge
Essential Question
How Can You Analyze Data Displayed in a Line Plot?
A.
A line plot, or dot plot, shows data along a number line. Each dot or X represents one value in the data set.
In science class, Abby and her classmates performed an experiment in which they used different amounts of vinegar. The table below shows how much vinegar each person used. What amount was most often used in the experiment?
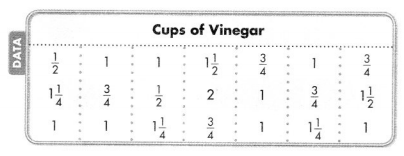
Answer:
1 cup vinegar was mostly used.
Explanation:
The amount which was most often used in the experiment 1 cup of vinegar.
A line plot shows how often each value occurs.

B.
Read the line plot.
A line plot can be used to organize the amount of vinegar each person used.
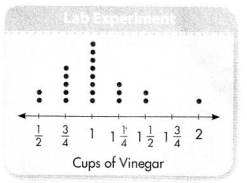
C.
Analyze the data. Use the data to answer your original question. What amount was most often used in the experiment?
Most of the data points are at 1, so 1 cup of vinegar was most often used in the experiment.
Convince Me! Reasoning How does the line plot show what the largest amount of vinegar used was?
Answer:
The line plot represents the data using number line. Here, we can see that the 1 cup of vinegar have mostly often used in the experiment.
Guided Practice
Do You Understand?
Question 1.
Why does data need to be ordered from least to greatest before creating a line plot?
Answer:
Here, the data need to be ordered from least to greatest before creating a line plot, so that the data from least to greatest can help us interpret the data to get the better sense of the numbers and scope of numbers we are working with.
Question 2.
In the line plot on the previous page, do any values occur the same number of times? Explain.
Answer:
The values that occur the same number of times is \(\frac{1}{2}\) and 1\(\frac{1}{2}\).
Explanation:
The values that occur the same number of times is \(\frac{1}{2}\) and 1\(\frac{1}{2}\) as they occur two times.
Question 3.
Describe any patterns in the line plot on the previous page.
Answer:
The pattern in the line plot is dot plot.
Do You Know How?
In 4 and 5, use the data set to answer the questions.
Question 4.
Students ran for 10 minutes. They ran the following distances, in miles:
\(\frac{3}{4}\), \(\frac{1}{2}\), 1\(\frac{3}{4}\), \(\frac{3}{4}\), 1
1\(\frac{1}{2}\), 1\(\frac{1}{4}\), 2, 1\(\frac{1}{2}\), 1, 1\(\frac{1}{4}\), \(\frac{3}{4}\), 1
How many distances are recorded?
Answer:
14 distances are recorded.
Explanation:
The number of distances recorded are 14 distances.
Question 5.
Use the line plot that shows the data.
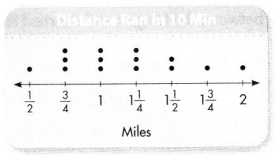
Which distances occurred most often?
Answer:
\(\frac{3}{4}\), 1 and 1\(\frac{1}{4}\).
Explanation:
The distances that occurs most often is \(\frac{3}{4}\), 1 and 1\(\frac{1}{4}\).
Independent Practice
Data in a line plot can be shown with dots or Xs.
In 6-8, use the line plot to answer the questions.
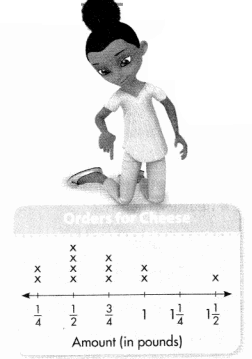
Question 6.
How many orders for cheese does the line plot show?
Answer:
12 orders.
Explanation:
The number of orders for cheese does the line plot shows is 12 orders.
Question 7.
Which amount of cheese was ordered most often?
Answer:
\(\frac{3}{4}\).
Explanation:
\(\frac{3}{4}\) amount of cheese was ordered most often.
Question 8.
How many more orders for \(\frac{3}{4}\) cheese were for a pound or less than for 1 pound or more?
Problem Solving
In 9-11, use the data set and line plot.
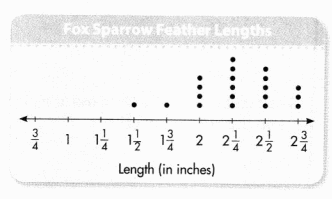
Question 9.
Jerome studied the feather lengths of some adult fox sparrows. How long are the longest feathers in the data set?
Answer:
2\(\frac{3}{4}\).
Explanation:
The longest feather length in the given data is 2\(\frac{3}{4}\).
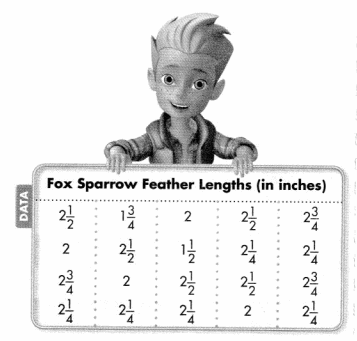
Question 10.
How many feathers are 2\(\frac{1}{4}\) inches or longer? Explain.
Answer:
8 feathers.
Explanation:
The number of feathers that are 2\(\frac{1}{4}\) inches or longer are 8 feathers.
Question 11.
Higher Order Thinking Jerome found another feather that made the difference between the longest and shortest feather 1\(\frac{3}{4}\) inches. What could be the length of the new feather? Explain.
Answer:
The difference is 1.
Explanation:
The difference between the longest and shortest feather is 2\(\frac{3}{4}\) – 1\(\frac{3}{4}\) = \(\frac{11}{4}\) – \(\frac{7}{4}\)
= \(\frac{4}{4}\).
= 1.
Question 12.
Reasoning How can you find the value that occurs most often by looking at a line plot?
Answer:
We can know the value that occurs most often by looking at a line plot by the size of the line plot. If the size is longer then that will be the most occurring on the line plot.
Question 13.
Draw and label a rectangle with a perimeter of 24 inches.
Answer:
Assessment Practice
Question 14.
Use the information shown in the line plot. What is the total weight of the 4 heaviest melons?
A. 6 pounds
B. 11\(\frac{1}{2}\) pounds
C. 22\(\frac{1}{2}\) pounds
D. 24 pounds
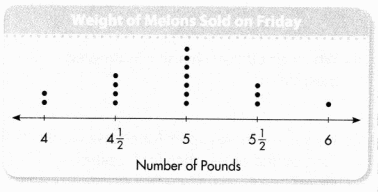
Answer:
Lesson 10.2 Make Line Plots
Activity
Solve & Share
A fifth-grade class recorded the height of each student. How could you organize the data? If all the students in the class lay down in a long line, how far would it reach? Make a line plot to solve this problem.
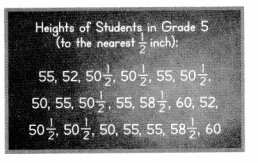
Answer:
Given that a fifth-grade class recorded the height of each student, so the line plot of the fifth-grade class is
Organizing data makes it easier to understand and analyze.
Look Back! Generalize How does organizing the data help you see the height that occurs most often? Explain.
Answer:
Organizing the data helps to communicate the data in a way that helps others to understand the data and interpret it correctly.
Visual Learning Bridge
Essential Question
How Can You Use a Line Plot to Organize and Represent Measurement Data?
Answer:
We can use a line plot to display and organize data and a line plot shows how many times each number appears in the data set.
A.
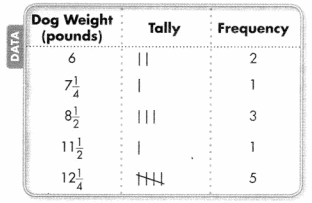
The dogs in Paulina’s Pet Shop have the following weights. The weights are in pounds.
How can you organize this information in a line plot?
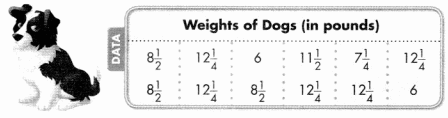
Answer:
The line plot of weights of dogs is
Measurement data that is organized is easier to use.
B.
Organize the data.
Write the weights from least to greatest.
6, 6, 7\(\frac{1}{4}\), 8\(\frac{1}{2}\), 8\(\frac{1}{2}\), 8\(\frac{1}{2}\), 11\(\frac{1}{2}\), 12\(\frac{1}{4}\), 12\(\frac{1}{4}\), 12\(\frac{1}{4}\), 12\(\frac{1}{4}\), 12\(\frac{1}{4}\)
You can also organize the data in a frequency table. The frequency is how many times a given response occurs.
C.
Make a line plot.
First draw the number line using an interval of \(\frac{1}{4}\). Then mark a dot for each value in the data set. Write a title for the line plot.
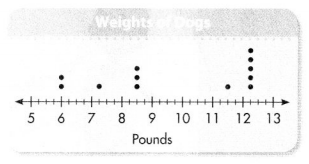
Convince Me! Reasoning Which weight occurs most often? Which weight occurs least often? How can you tell from the line plot?
Guided Practice
Do You Understand?
Question 1.
In the line plot of dog weights on the previous page, what does each dot represent?
Answer:
Here, each dot represents the weight of the dog.
Question 2.
In a line plot, how do you determine the values to show on the number line?
Answer:
Do You Know How?
Question 3.
Draw a line plot to represent the data.
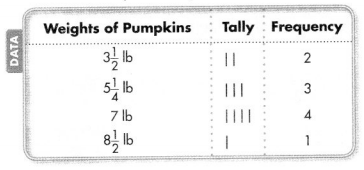
Answer:
The line plot of weights of pumpkins is
Independent Practice
In 4 and 5, complete the line plot for each data set.
Double check that you have a dot for each value.

Question 4.
11\(\frac{1}{4}\), 12\(\frac{1}{2}\), 11\(\frac{1}{4}\), 14\(\frac{3}{4}\), 10\(\frac{1}{2}\), 11\(\frac{1}{4}\), 12
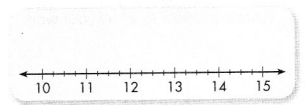
Answer:
The line plot of the given value
Question 5.
1\(\frac{1}{8}\), 2, 1\(\frac{1}{2}\), 1\(\frac{1}{4}\), 1\(\frac{1}{8}\), 1, 2, 1\(\frac{1}{2}\), 1\(\frac{1}{4}\)
Answer:
The line plot of the given values is
In 6 and 7, construct a line plot for each data set.
Question 6.
\(\frac{1}{2}\), \(\frac{3}{4}\), \(\frac{3}{4}\), 1, 1, 0, \(\frac{1}{2}\), \(\frac{1}{2}\), \(\frac{3}{4}\)
Answer:
The line plot of the given values is
Question 7.
5\(\frac{1}{2}\), 5, 5, 5\(\frac{1}{8}\), 5\(\frac{3}{4}\), 5\(\frac{1}{4}\), 5\(\frac{1}{2}\), 5\(\frac{1}{8}\), 5\(\frac{1}{2}\), 5\(\frac{3}{8}\)
Answer:
The line plot of the given values is
Problem Solving
In 8-10, use the data set.
Question 8.
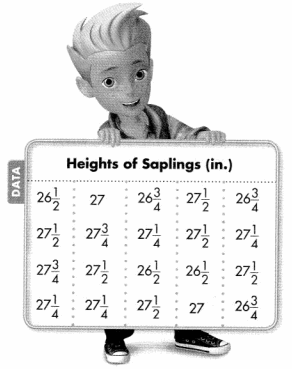
Make Sense and Persevere Martin’s Tree Service purchased several spruce tree saplings. Draw a line plot of the data showing the heights of the saplings.
Answer:
Question 9.
How many more saplings with a height of 27\(\frac{1}{4}\) inches or less were there than saplings with a height greater than 27\(\frac{1}{4}\) inches?
Answer:
There are 11 saplings.
Explanation:
The number of saplings that are with a height of 27\(\frac{1}{4}\) inches or less was there than saplings with a height greater than 27\(\frac{1}{4}\) inches are 11 saplings.
Question 10.
Higher Order Thinking Suppose Martin’s Tree Service bought two more saplings that were each 27\(\frac{1}{4}\) inches tall. Would the value that occurred most often change? Explain your answer.
Answer:
Yes, the value that occurred most often will change.
Explanation:
Yes, the value that occurred most often will be changed. As there will be an increase of saplings with the height of 27\(\frac{1}{4}\) inches tall, so the value that occurred most often will change.
Question 11.
Why is organizing data helpful?
Answer:
Organizing data is very useful, by this we can find the values easily and can complete our work fastly.
Question 12.
Randall buys 3 tickets for a concert for $14.50 each. He gives the cashier a $50 bill. How much change does he get? Write equations to show your work.
Answer:
The change that will get to Randell is $6.50 and the equation is $50 – $43.50 = $6.50.
Explanation:
Given that Randall buys 3 tickets for a concert for $14.50 each and he gives the cashier a $50 bill, so the total cost for the tickets will be 3 × 14.50 which is $43.50. So the change that will get to Randell is $50 – $43.50 which is $6.5. So the equation is $50 – $43.50 = $6.50.
Assessment Practice
Question 13.
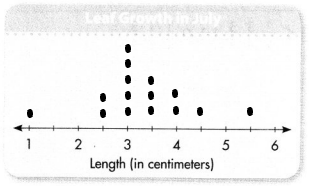
Amy measured how many centimeters the leaves on her houseplants grew in July. Use the leaf growth data below to complete the line plot on the right.
2\(\frac{1}{2}\), 4\(\frac{1}{2}\), 4, 4, 3, 1, 3, 3\(\frac{1}{2}\), 3\(\frac{1}{2}\), 3\(\frac{1}{2}\), 2\(\frac{1}{2}\), 3, 3\(\frac{1}{2}\), 3\(\frac{1}{2}\), 5\(\frac{1}{2}\)
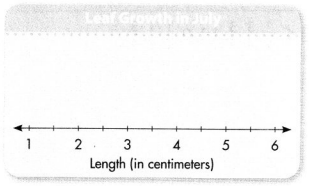
Answer:
The line plot of the given data is
Lesson 10.3 Solve Word Problems Using Measurement Data
Solve & Share
Rainfall for the Amazon was measured and recorded for 30 days. The results were displayed in a line plot. What can you tell about the differences in the amounts of rainfall? Use the line plot to solve this problem.
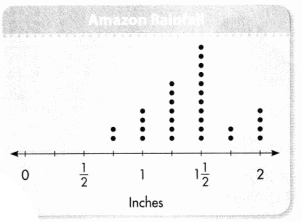
You can use a representation to analyze data. Show your work!
Look Back! Reasoning What is the difference between the greatest amount of rain in a day and the least amount of rain in a day? How can you tell?
Answer:
The difference is 9 days.
Explanation:
The difference between the greatest amount of rain in a day and the least amount of rain in a day is 11 – 2 which is 9. By using subtraction we can tell that.
Visual Learning Bridge
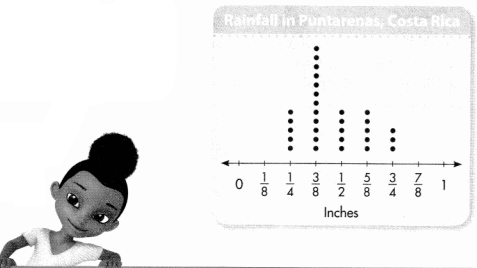
Essential Question How Can You Use Measurement Data Represented in a Line Plot to Solve Problems?
A.
Bruce measured the daily rainfall while working in Costa Rica. His line plot shows the rainfall for each day in September. What was the total rainfall for the month?
You can use the line plot to make a frequency table.
B.
Multiply each value by the frequency to find the amount of rain for that value. Then add the products to find the number of inches of rainfall for the month.
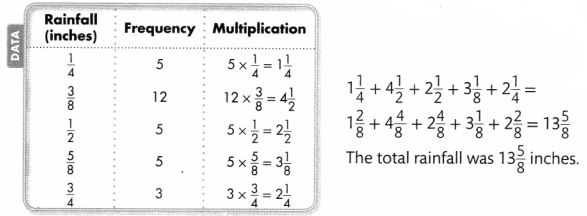
The table helps you organize the numerical data for your calculations.
Convince Me! Critique Reasoning Rosie says she can find the total rainfall in the example above without multiplying. Do you agree? Explain.
Answer:
Yes, we can find the total rainfall.
Explanation:
Yes, we can find the total rainfall in the example above without multiplying. By adding them we can also find the total rainfall.
Guided Practice
Do You Understand?
In 1-4, use the line plot showing how many grams of salt were left after liquids in various containers evaporated.
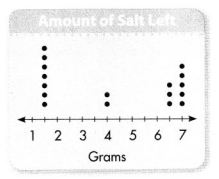
Question 1.
How could you find the difference between the greatest amount and the least amount of salt left?
Answer:
The difference is 5.
Explanation:
The difference between the greatest amount and the least amount of salt left is 7 – 2 which is 5.
Do You Know How?
Question 2.
Write a problem that can be answered using the line plot.
Answer:
Question 3.
Write and solve an equation that represents the total number of grams of salt left.
Answer:
The equation is 7 × 1 \(\frac{1}{2}\) + 4 × 2 + 3 × 6 \(\frac{1}{2}\) + 7 × 5 = 73.
Explanation:
The total number of grams of salt is 7 × 1 \(\frac{1}{2}\) + 4 × 2 + 3 × 6 \(\frac{1}{2}\) + 7 × 5 = 7 × \(\frac{3}{2}\) + 8 + 3 × \(\frac{13}{2}\) + 35
= \(\frac{21}{2}\) + 8 + \(\frac{39}{2}\) + 35
= \(\frac{21+16+39+70}{2}\)
= \(\frac{146}{2}\)
= 73.
And the equation is 7 × 1 \(\frac{1}{2}\) + 4 × 2 + 3 × 6 \(\frac{1}{2}\) + 7 × 5 = 73.
Question 4.
How many grams of salt would be left if two of each container were used?
Answer:
The number of grams of salt is 36 \(\frac{1}{2}\).
Explanation:
The number of grams of salt that would be left if two of each container were used is 73 ÷ 2 which is 36 \(\frac{1}{2}\).
Independent Practice
In 5 and 6, use the line plot Allie made to show the lengths of strings she cut for her art project.
Question 5.
Write an equation for the total amount of string.
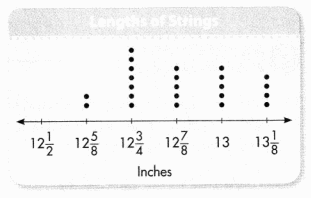
Answer:
The equation is 2 × 12 \(\frac{5}{8}\) + 7 × 12 \(\frac{3}{4}\) + 5 × 12 \(\frac{7}{8}\) + 5 × 13 + 4 × 13 \(\frac{1}{8}\) = 413 \(\frac{1}{4}\).
Equation:
The equation for the total amount of string is 2 × 12 \(\frac{5}{8}\) + 7 × 12 \(\frac{3}{4}\) + 5 × 12 \(\frac{7}{8}\) + 5 × 13 + 4 × 13 \(\frac{1}{8}\)
= 2 × \(\frac{101}{8}\) + 7 × \(\frac{51}{4}\) + 5 × \(\frac{103}{4}\) + 65 + 4 × \(\frac{105}{4}\)
= \(\frac{202}{8}\) + \(\frac{357}{4}\) + \(\frac{515}{4}\) + 65 + \(\frac{420}{4}\)
= \(\frac{202+714+1030+520+840}{8}\)
= \(\frac{3306}{8}\)
= 413 \(\frac{1}{4}\).
Question 6.
What is the difference in length between the longest and the shortest lengths of string?
Answer:
The difference is 2.
Explanation:
The difference in length between the longest and the shortest lengths of the string is 7 – 2 which is 5.
Problem Solving
In 7 and 8, use the line plot Susannah made to show the amount of rainfall in one week.
Question 7.
Algebra Write and solve an equation for the total amount of rainfall, r, Susannah recorded.
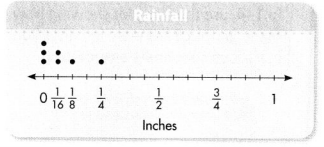
Answer:
The equation will be 2 × \(\frac{1}{16}\) + 1 × \(\frac{1}{8}\) + 1 × \(\frac{1}{4}\) = \(\frac{1}{2}\).
Explanation:
The equation for the total amount of rainfall is 2 × \(\frac{1}{16}\) + 1 × \(\frac{1}{8}\) + 1 × \(\frac{1}{4}\)
= \(\frac{1}{8}\) + \(\frac{1}{8}\) + \(\frac{1}{4}\)
= \(\frac{1+1+2}{8}\)
= \(\frac{4}{8}\)
= \(\frac{1}{2}\).
Question 8.
Higher Order Thinking Suppose the same amount of rain fell the following week, but the same amount of rain fell each day. How much rain fell each day?
Answer:
Question 9.
Make Sense and Persevere The area of a square deck is 81 square feet. How long is each side of the deck?
Answer:
The length of each side is 9.
Explanation:
Given that the area of a square deck is 81 square feet, so the length of each side of the deck is
Area = S × S = 81
S × S = 9 × 9
S = 9.
How does knowing the shape of the deck help you?

Question 10.
Althea recorded the amount she earned from T-shirt sales each day for 14 days. She made a frequency table to organize the data. Write a problem that can be answered by using the frequency table.
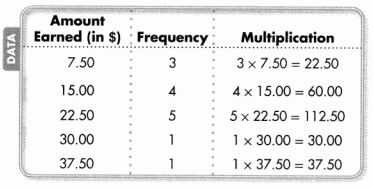
Answer:
Assessment Practice
Question 11.
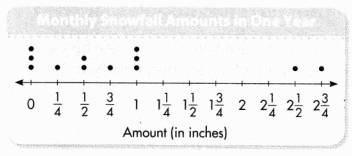
Kurt recorded the amount of snowfall in each month for one year. What was the total snowfall that year?
A. 12 in.
B. 10\(\frac{1}{4}\) in.
C. 7\(\frac{3}{4}\) in.
D. 10\(\frac{1}{2}\) in.
Answer:
The total snowfall of that year is 10\(\frac{1}{4}\).
Equation:
Given that Kurt recorded the amount of snowfall in each month for one year, so the total snowfall of that year is 1 × \(\frac{1}{4}\) + 2 × \(\frac{1}{2}\) + 1 × \(\frac{3}{4}\) + 3 × 1 + 1 × 2\(\frac{1}{2}\) + 1 × 2\(\frac{3}{4}\)
= \(\frac{1}{4}\) + \(\frac{2}{2}\) + \(\frac{3}{4}\) + 3 + \(\frac{9}{4}\) + \(\frac{11}{4}\)
= \(\frac{1+4+3+12+10+11}{4}\)
= \(\frac{41}{4}\)
= 10\(\frac{1}{4}\).
Lesson 10.4 Critique Reasoning
Activity
Problem Solving
Solve & Share
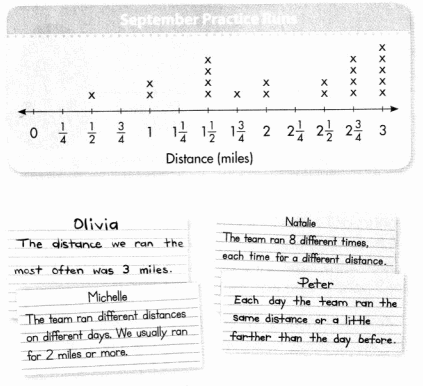
A cross country coach recorded the team’s practice runs and made the line plot below. The coach had each runner analyze the line plot and write an observation. Read the statements and explain whether you think each runner’s reasoning makes sense.
Thinking Habits
Be a good thinker! These questions can help you.
• What questions can I ask to understand other people’s thinking?
• Are there mistakes in other people’s thinking?
• Can I improve other people’s thinking?

Look Back! Critique Reasoning Quinn said that to find the total distance the team ran in September, you add each number that has an X above it: \(\frac{1}{2}\) + 1 + 1\(\frac{1}{2}\) + 1\(\frac{3}{4}\) + 2 + 2\(\frac{1}{2}\) + 2\(\frac{3}{4}\) + 3. Do you agree? Explain why or why not.
Visual Learning Bridge
Essential Question How Can You Critique the Reasoning of Others?
A.
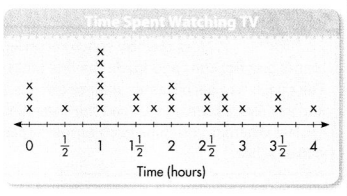
Ms. Kelly’s class made a line plot showing how many hours each student spent watching television the previous evening. Amanda said, “No one watched TV for 3 hours.” Drake said, “No, 3 of us watched no TV.” Who is correct? Explain your reasoning.
What information do Amanda and Drake use for reasoning?
Amanda and Drake base their reasoning on their analysis of the data displayed on the line plot.
B.
How can I critique the reasoning of others?
I can
• decide if the statements make sense.
• look for mistakes in calculations.
• clarify or correct flaws in reasoning.
Here’s my thinking.

C.
Amanda’s statement is incorrect. Her reasoning has flaws. She sees the 3 Xs above the zero and thinks that means that zero people watched 3 hours of TV. The labels on the number line tell how many hours, and the Xs tell how many students. So, Amanda should have said, “There are 3 people who watched 0 hours of TV.”
Drake’s statement is correct. Since there are 3 Xs above the o, he is correct when he says that 3 people watched no TV.
Convince Me! Critique Reasoning Andre said, “More than half of us watched TV for less than 2 hours.” Explain how you can critique Andre’s reasoning to see if his thinking makes sense.
Guided Practice
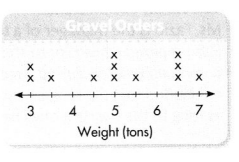
Renee works for a sand and gravel company. She made a line plot to show the weight of the gravel in last week’s orders. She concluded that one third of the orders were for more than 6 tons.
Question 1.
What is Renee’s conclusion? How did she support it?
Answer:
Question 2.
Describe at least one thing you would do to critique Renee’s reasoning.
Answer:
Question 3.
Does Renee’s conclusion make sense? Explain.
Answer:
Independent Practice
Critique Reasoning
Aaron made a line plot showing the weights of the heads of cabbage he picked from his garden. He said that since 1\(\frac{1}{2}\) + 2 + 2\(\frac{1}{4}\) + 2\(\frac{3}{4}\) = 8\(\frac{1}{2}\), the total weight of the cabbages is 8\(\frac{1}{2}\) pounds.
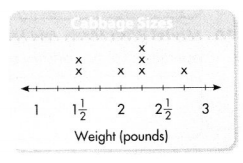
Question 4.
Describe at least one thing you would do to critique Aaron’s reasoning
Answer:
Question 5.
Is Aaron’s addition accurate? Show how you know.
Answer:
When you critique reasoning, you need to explain if someone’s method makes sense.

Question 6.
Can you identify any flaws in Aaron’s thinking? Explain.
Answer:
Question 7.
Does Aaron’s conclusion make sense? Explain.
Answer:
Problem Solving
Performance Task
Television Commercials
Ms. Fazio is the manager of a television station. She prepared a line plot to show the lengths of the commercials aired during a recent broadcast. She concluded that the longest commercials were 3 times as long as the shortest ones because 3 × \(\frac{1}{2}\) = 1\(\frac{1}{2}\).
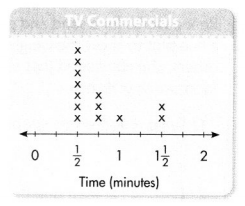
Question 8.
Make Sense and Persevere Which information in the line plot did Ms. Fazio need to use in order to draw her conclusion?
Answer:
Question 9.
Reasoning Did the number of Xs above the number line affect Ms. Fazio’s conclusion? Explain.
Answer:
To use math precisely, you need to check that the words, numbers, symbols, and units you use are correct and that your calculations are accurate.

Question 10.
Model With Math Did Ms. Fazio use the correct operation to support her conclusion? Explain.
Answer:
Question 11.
Be Precise Are Ms. Fazio’s calculations accurate? Show how you know.
Answer:
Question 12.
Critique Reasoning Is Ms. Fazio’s conclusion logical? How did you decide? If not, what can you do to improve her reasoning?
Answer:
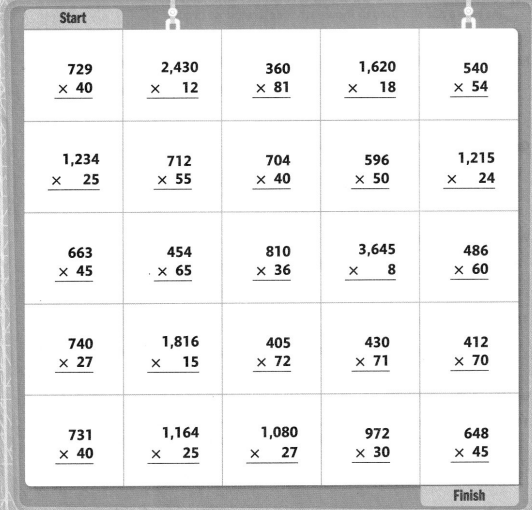
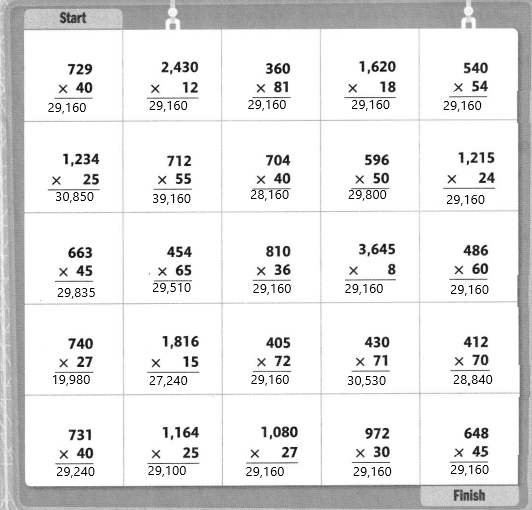
Topic 10 Fluency Practice
Activity
Follow the Path
Solve each problem. Follow problems with an answer of 29,160 to shade a path from START to FINISH. You can only move up, down, right, or left.
Topic 10 Vocabulary Review
Glossary
Understand Vocabulary
Choose the best term from the Word List. Write it on the blank.
Word List
• bar graph
• data
• frequency table
• line plot
Question 1.
Another name for collected information is _____
Answer:
Another name for collected information is data.
Question 2.
A ___ uses tally marks to show how many times a data value occurs in a data set.
Answer:
A frequency table uses tally marks to show how many times a data value occurs in a data set.
Question 3.
A(n) ___ is a display of responses on a number line with a dot or X used to show each time a response occurs.
Answer:
A line plot is a display of responses on a number line with a dot or X used to show each time a response occurs.
Round the data to the nearest whole number and order from least to greatest.
Question 4.
2.3, 8.6, 5.5, 4.9
Answer:
2.3, 4.9, 5.5, 8.6.
Explanation:
The nearest whole number and order from least to greatest are 2.3, 4.9, 5.5, 8.6.
Question 5.
42.1, 50, 37.2, 76.5, 43.9
Answer:
37.2, 42.1, 43.9, 50, 76.5.
Explanation:
The nearest whole number and order from least to greatest are 37.2, 42.1, 43.9, 50, 76.5.
Order each data set from least to greatest.
Question 6.
1\(\frac{1}{2}\), 0, 1\(\frac{3}{4}\), 13\(\frac{1}{2}\), 1\(\frac{2}{3}\)
Answer:
0, 1\(\frac{1}{2}\), 1\(\frac{2}{3}\), 13\(\frac{1}{2}\).
Explanation:
The nearest whole number and order from least to greatest are 0, 1\(\frac{1}{2}\), 1\(\frac{2}{3}\), 13\(\frac{1}{2}\).
Question 7.
\(\frac{6}{7}\), 2\(\frac{1}{2}\), \(\frac{3}{4}\), 1, 1\(\frac{3}{4}\)
Answer:
\(\frac{3}{4}\), \(\frac{6}{7}\), 1, 1\(\frac{3}{4}\), 2\(\frac{1}{2}\).
Explanation:
The nearest whole number and order from least to greatest are \(\frac{3}{4}\), \(\frac{6}{7}\), 1, 1\(\frac{3}{4}\), 2\(\frac{1}{2}\).
Write always, sometimes, or never.
Question 8.
A line plot is ____ the best way to display data.
Answer:
A line plot is always the best way to display data.
Question 9.
A data display ___ uses fractions or decimals.
Answer:
A data display sometimes uses fractions or decimals.
Question 10.
Cross out the words that are NOT examples of items that contain data.
Encyclopedia Alphabet Email address MP3 Player Phone number Grocery list
Use Vocabulary in Writing
Question 11.
Twenty students measured their heights for an experiment in their science class. How can a line plot help the students analyze their results?
Answer:
Given that twenty students measured their heights for an experiment in their science class, here line plot helps the students analyze their results by comparing sets of data and track changes over time.
Topic 10 Reteaching
Set A
pages 429-432
The data set below shows the number of cartons of milk drank by 20 students in a week.
2, 4, 3\(\frac{1}{2}\), \(\frac{1}{2}\), 1\(\frac{1}{2}\), 1\(\frac{1}{2}\), 3\(\frac{1}{2}\), 2, 3, \(\frac{1}{2}\), 1, 3\(\frac{1}{2}\), 3, 2, 1, 3\(\frac{1}{2}\), 1, 3, 3\(\frac{1}{2}\), 2
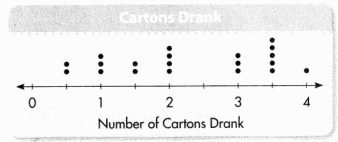
The line plot shows how often each data value occurs.

Use the Cartons Drank line plot.
Question 1.
How many students drank 1\(\frac{1}{2}\) cartons?
Answer:
2 students.
Explanation:
2 students drank 1\(\frac{1}{2}\) cartons.
Question 2.
How many students drank more than 2\(\frac{1}{2}\) cartons?
Answer:
9 students.
Explanation:
9 students drank more than 2\(\frac{1}{2}\) cartons.
Question 3.
What was the greatest number of cartons drank by a student?
Answer:
4 cartons.
Explanation:
The greatest number of cartons drank by a student is 4 cartons.
Question 4.
How many students drank only 1 carton?
Answer:
3 students.
Explanation:
3 students drank only 1 carton.
Question 5.
What is the difference between the greatest and least number of cartons drank?
Answer:
The difference is 5 – 1 = 4.
Explanation:
The difference between the greatest and least number of cartons drank is 5 – 1 which is 4.
Set B
pages 433-436
Twelve people were surveyed about the number of hours they spend reading books on a Saturday. The results are:
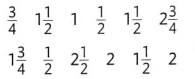
Draw a number line from 0 to 3. Mark the number line in fourths because the survey results are given in \(\frac{1}{4}\) hours. Then for each response, place a dot above the value on the number line.
Remember that you can make a line plot to show and compare data.
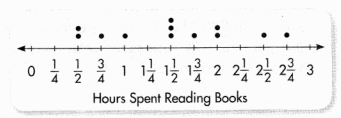
Use the information below to make a line plot about Patrick’s plants.
Patrick listed how many inches his plants grew in one week: 1 \(\frac{1}{2}\) \(\frac{3}{4}\) 1\(\frac{1}{2}\) \(\frac{1}{2}\) 1\(\frac{1}{4}\) \(\frac{1}{2}\) 1
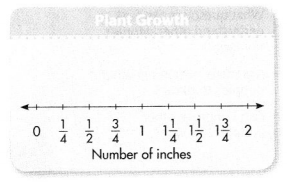
Question 1.
Complete the line plot.
Answer:
The line plot is
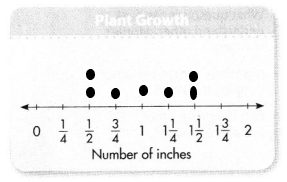
Question 2.
How many dots are on the line plot?
Answer:
7 dots.
Explanation:
There are 7 dots on the line plot.
Question 3.
How many inches of plant growth was the most common?
Answer:
\(\frac{1}{2}\) and 1\(\frac{1}{2}\).
Explanation:
The most common plant growth in inches is \(\frac{1}{2}\) and 1\(\frac{1}{2}\).
Set C
pages 437-440
This line plot shows the amount of flour Cheyenne needs for several different recipes. She organizes the data in a frequency table to calculate the total amount of flour she needs.
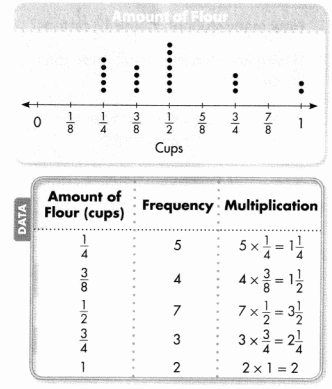
Remember that you can multiply each data value by its frequency to find the total amount.
Use the line plot and frequency table at the left.
Question 1.
What values are multiplied in the third column of the table?
Answer:
\(\frac{1}{2}\) × 7 = 3\(\frac{1}{2}\).
Explanation:
The value multiplied in the third column of the table is \(\frac{1}{2}\) × 7 which is 3\(\frac{1}{2}\).
Question 2.
Write and solve an equation to find the total amount of flour Cheyenne needs.
Answer:
Set D
pages 441-444
Think about these questions to help you critique the reasoning of others.
Thinking Habits
• What questions can I ask to understand other people’s thinking?
• Are there mistakes in other people’s thinking?
• Can I improve other people’s thinking?

Remember you need to carefully consider all parts of an argument.
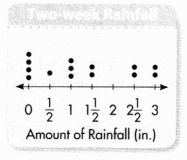
Question 1.
Justin says the line plot shows that the daily rainfall for the past two weeks is about an inch. Do you agree with his reasoning? Why or why not?
Answer:
Topic 10 Assessment Practice
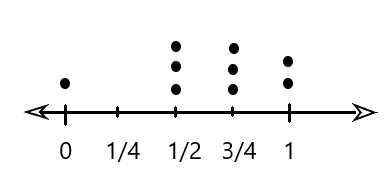
Question 1.
Which line plot shows the data?
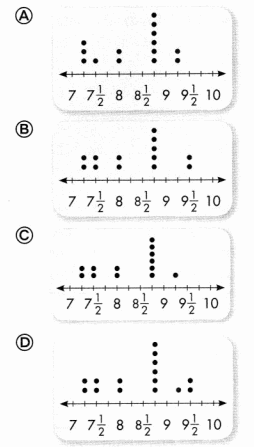
Answer:
Option A shows correct line plot.
Question 2.
The line plot shows the results from a survey asking parents how many children they have in school. How many parents have two children in school?
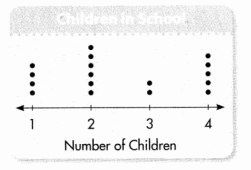
Answer:
6 parents.
Explanation:
The number of parents have two children in the school are 6 parents.
Question 3.
Georgiana made a line plot of the amount of time she spent practicing her violin each day in the past two weeks.
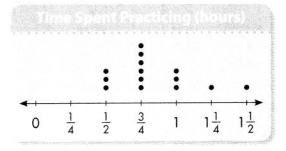
A. What is the difference between the greatest and least times spent practicing?
B. What is the most common amount of time she spent practicing?
C. What is the total amount of time Georgiana practiced? Write and solve an equation to show your work.
Answer:
The difference is 5.
The common amount of time is \(\frac{3}{4}\).
The equation is 3 \(\frac{1}{2}\) + 6 × \(\frac{3}{4}\) + 3 × 1 + 1 × 1\(\frac{1}{4}\) + 1 × 1\(\frac{1}{2}\) = 11\(\frac{3}{4}\).
Explanation:
The difference between the greatest and least times spent practicing is 6 – 1 which is 5.
The most common amount of time she spent practicing is \(\frac{3}{4}\).
The total amount of time Georgiana practiced is 3 \(\frac{1}{2}\) + 6 × \(\frac{3}{4}\) + 3 × 1 + 1 × 1\(\frac{1}{4}\) + 1 × 1\(\frac{1}{2}\) on solving we will get 11\(\frac{3}{4}\).
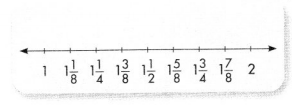
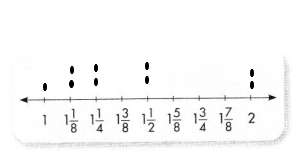
Ashraf and Melanie cut rope into different lengths for an art project. They made a line plot to display their data. Use the line plot to answer 4-6.
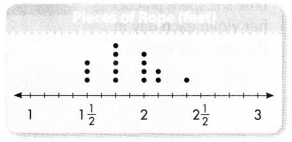
Question 4.
Which is the most common length of rope?
A. 1\(\frac{5}{8}\) ft
B. 1\(\frac{3}{4}\) ft
C. 1\(\frac{7}{8}\) ft
D. 2\(\frac{3}{8}\) ft
Answer:
The most common length of the rope is 1\(\frac{5}{8}\) ft
Question 5.
Which is the total length of rope represented by the data?
A. 25\(\frac{1}{8}\) ft
B. 27\(\frac{5}{8}\) ft
C. 27\(\frac{7}{8}\) ft
D. 28 ft
Answer:
Question 6.
Suppose 2 more pieces of rope are cut to be 2 feet. Would the value that occurred most often change? Explain your reasoning.
Answer:
Question 7.
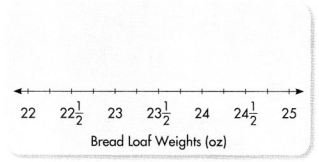
Terry works at a bakery. This morning he recorded how many ounces each loaf of bread weighed.
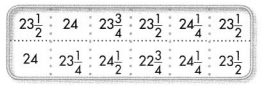
A. Make a line plot for the data set.
Answer:
The line plot is
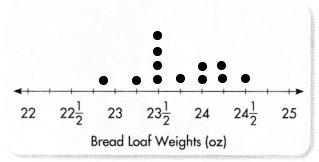
B. Morgan said that the difference between the heaviest loaf of bread and the lightest loaf of bread is 1\(\frac{1}{2}\) ounces. Do you agree with Morgan? Explain.
C. What is the combined weight of all the loaves of bread? Show your work.
Answer:
Topic 10 Performance Task
Measuring Bugs
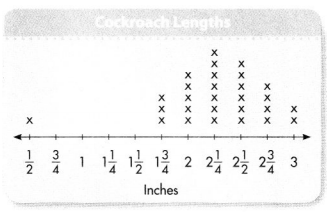
Ms. Wolk’s class measured the length and weight of Madagascar Hissing Cockroaches.
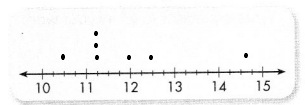
Question 1.
The Cockroach Lengths line plot shows the lengths the class found.
Part A
Which length did the most students get? How can you tell from the line plot?
Answer:
The length did the most students get is 2\(\frac{1}{4}\).
Explanation:
The length did the most students get is 2\(\frac{1}{4}\), we can say by seeing the number of length more.
Part B
Jordan said that all of the Madagascar Hissing Cockroaches were between 2 and 3 inches long. Is he correct? Explain your reasoning.
Part C
Ginny said that twice as many students found a length of 2\(\frac{1}{2}\) inches as found a length of 1\(\frac{3}{4}\) inches. Is she correct? Explain your reasoning.
Part D
How many cockroaches were measured for the data set? How do you know?
Answer:
28 cockroaches.
Explanation:
The number of cockroaches were measured for the data set is 28 cockroaches.
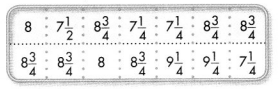
Question 2.
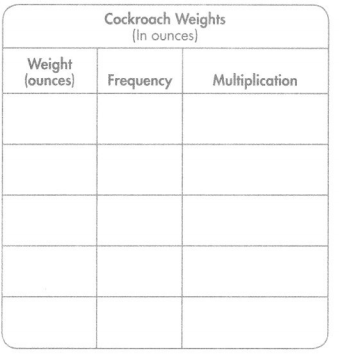
The Cockroach Weights table shows the weights the class found.
Part A
Complete the line plot to represent the cockroach weights.
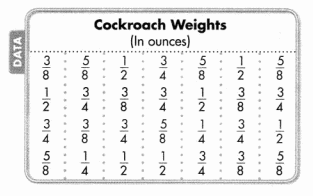
Part B
What is the total weight of all the cockroaches the students measured? Complete the table to help you. Show your work.
Answer: