Comparison of Two Digit Numbers

Comparison of Two Digit Numbers – Definition, Examples | How to Compare 2 Digit Numbers?

If you are looking for the concept of two-digit numbers, you have landed on the correct page. This page gives you clear information about two-digit numbers,two-digit number definition, comparison of two-digit numbers, arranging 2 digit numbers in ascending order, descending order. Also, find examples of comparison of two-digit numbers so that you can solve related problems on your own.

Also, Read:

Two-Digit Numbers – Definition

Two-digit numbers have two digits. The last digit from the right-hand side represents one’s place and the other digit represents tens place. Two-digit numbers start from 10 and end with 99. Example of two-digit numbers are 10,14, 17, 19, 25, 50, 100 etc.

How do you Compare Two-Digit Numbers?

When comparing two-digit numbers we use greater than symbol(>) for greater values and less than a symbol for lesser values. When both the numbers are equal then we use equal to (=). The two other symbols used for comparison are ≥ (greater than or equal to) and ≤ (less than or equal to).

When comparing two digits we must consider the following rules.
  • The number which has greater valued digit at ten’s place is greater as compared to other:85 > 24, 98 > 53 , 65 > 29 ,72>33,49>14 etc.
  •  If the digits at ten’s place of both the numbers are equal, then the digits at one’s place of both the numbers are compared. The number which has the greater digit at one’s place is greater than the other.43>42, 65>61, 15>11,29>25,38>36 etc.consider other examples on comparison of two-digit numbers.

Comparing 2 Digit Numbers Examples

Example 1.

Compare Two-digit numbers 72, 47.

Solution:

In 72 7 is in the tens place and 2 is in one’s place.

In 47 4 is in the tens place and 7 is in one’s place.

When we compare tens place of both the numbers 7>4.So 72>47.

Example 2.

Compare two digit numbers 95, 68.

Solution:

In 95 9 is in the tens place and 5 is in one’s place.

In 68 6 is in the tens place and 8 is in one’s place.

when we compare tens place of both the numbers 9>6.So 95>68.

Example 3.

Compare two digits 65, 84.

Solution:

In 65 6 is in the tens place and 5 is in one’s place.

In 84 8 is in the tens place and 4 is in one’s place.

when we compare tens place of both the numbers 8>6.So 84>65

Example 4.

Compare two digits 69, 63.

Solution:

In 69 6 is in the tens place and 9 is in one’s place.

In 63 6 is in the tens place and 3 is in one’s place.

When we compare, tens place of both the numbers are same i.e.  6. so compare one’s digit of both the numbers. one’s digit of 69 is 9 and one’s digit of 63 is 3.

9>3.

So 69 is greater than 63.

Example 5.

Compare two digit numbers 81, 85.

Solution:

In 81 8 is in the tens place and 1 is in one’s place.

In 85 8 is in the tens place and 5 is in one’s place.

when we compare, the tens place of both the numbers is the same. Compare one’s place of both the numbers5>1. So 85 is greater than 81.

Example 6.

Compare two digit numbers 71, 78?

Solution:

In 71 7 is in the tens place and 1 is in one’s place.

In 78 7 is in the tens place and 8 is in one’s place.

when we compare, the tens place of both the numbers is the same. compare one’s place of both the numbers8>1. So 78 is greater than 71.

Two-Digit numbers are always greater than the one-digit number. Consider the following examples

15>9, 25>5, 33>6, 68>8, 18>9, 12>4 etc.

Numbers can be arranged in two ways. One is in Ascending Order and the other one is Descending Order.

Arranging 2 Digit Numbers in Ascending Order

Ascending order means to arrange numbers from smallest to largest. i.e. smaller digit numbers come first and then larger numbers.

For example Arrange the numbers 15,92,27,87,62,23,48,63,76 in ascending order.

Ascending order are 15, 23,27, 48,62, 63, 76,

Arrange the numbers 12,22,66,43,56,85,14,10,38 in ascending order.

Ascending order are 10, 12, 14, 22, 38, 43, 56, 66, 85.

Arrange the numbers 52,22,66,14,56,85,64,70,38 in ascending order.

Ascending order are 14, 22, 38, 52, 56, 64, 66, 70, 85.

Arrange the numbers 85,12,76,41,96,58,44,20,68 in ascending order.

Ascending order are 12, 20, 41, 44, 58, 68, 76, 85, 96.

Arranging 2 Digits Numbers in Descending Order

Descending order means arranging numbers from largest to smallest. i.e. larger digit numbers come first and then smaller numbers.

Consider the following examples

Arrange the numbers 75,32,66,11,96,58,34,20,48 in Descending order.

Descending order are 96, 75, 66, 58, 48, 34, 32, 20, 11.

Arrange the numbers 15,72,66,11,69,28,54,20,98 in Descending order.

Descending order are 98, 72, 69, 66, 54, 28, 20, 15, 11.

Arrange the numbers 13,32,46,10,29,78,42,60,88 in Descending order.

Descending order are 88, 78, 60, 46, 42, 32, 29, 13, 10.

Arrange the numbers 18,62,36,48,29,78,42,20,80in Descending order.

Descending order are 80, 78, 62, 48, 42, 36, 29, 20, 18.

FAQ’S on 2 Digits Comparison

1. What is a two-digit number?

A two-digit number has two digits.

2. What is the smallest two-digit number?

The smallest two-digit number is 10.

3. What is the largest two-digit number?

The largest two-digit number is 99.

4. How many two-digit numbers are there?

There are 90 two-digit numbers.

Class Limits in Exclusive and Inclusive Form

Class Limits in Exclusive and Inclusive Form – Definitions, Examples | How to find Class Limits in Exclusive and Inclusive Form?

The class limit corresponds to a class interval and the class limits are defined as the minimum value and the maximum value of the class interval may be contained. The maximum value in the class is known as the Upper-class limit whereas the minimum value in the class is known as the Lower class limit. The Lower Class Limit is represented as LCL  and the Upper-Class Limit is represented as UCL. Class limits have two series (or) form one is exclusive series (or) form and another one is inclusive series (or) form.

The Upper-Class Limit of a class is the largest data value that will go into the class and the lower class limit of a class is the smallest data value that can go into the class. Class limits have an equivalent accuracy of knowledge values, an equivalent number of decimal places because of the data values.

Read More:

Exclusive Form – Definition

The exclusive form is defined as the series in which the upper limit is not included in the class and is included in an upcoming class. The exclusive series of a class type is a continuous series. Consider the example of the exclusive form is  0- 10, 10- 20, 20- 30, 30- 40, 40- 50 we can also see that the upper limit of the class is included in the next class interval. In exclusive form, the lower class limit and upper-class limit are known as true lower class limit and true upper-class limit of the interval.

Inclusive Form of Class Limit – Definition

The inclusive form of class limit is defined as when the lower class limit and the upper-class limit are included, then it is an inclusive class interval. Consider the example of the inclusive form is 0- 10, 11- 20, 21- 20, 31- 40, etc are the inclusive type of class intervals. Usually, in the case of discrete variables, the inclusive form of class intervals is used.

The inclusive class limit series are obtained by subtracting 0.5 from the lower class limit and adding 0.5 to the upper-class limit. Therefore, class limits of 10- 20 class intervals in the inclusive form are 9.5 is the lower class limit and 20.5 is the upper-class limit.

Related Terms to Class Limits

Below we have provided related terms of class limits along with their definitions in detail. They are explained as such

Class Mark

The classmark is also called the Class midpoint. The classmark is a specific point in the center of the categories in a frequency distribution table. Classmark is also the center of a bar in a histogram. It is defined as the average of the upper class and lower class limit.

Therefore, Class Mark = ½ (upper-class limit + lower class limit)

Class Size

The difference between the true lower class limit and the true upper-class limit is called Class size. The class size will always remain the same in all the class intervals.

Range

The difference between the maximum value of observation and the minimum value of observation is called Range.

Difference between Exclusive and Inclusive Class Limits

                         Exclusive Class Limit              Inclusive Class Limit
1. When the upper limit of the class is excluded from the class and is included in the next class or upcoming class, it is called the exclusive class limit. 1. In the inclusive class limit, the upper-class limit of a class interval is included in the class itself.
2. Exclusive class limit is suitable for continuous variables. 2. Inclusive class limit is suitable for discrete variables
3. In the exclusive class limit, the class intervals are 10- 20, 20- 30, 30- 40. 3. In the inclusive class limit, the class intervals are 10- 20, 21- 30, 31- 40.

Inclusive and Exclusive Class Interval Examples

Problem 1:

Find the upper-class limit in inclusive form for the class interval of 20- 25.

Solution:

Given, the class interval of 20- 25,

Now, we can find the upper-class limit of an inclusive

We know that in an inclusive class limit subtracting 0.5 on the lower class limit and adding 0.5 on the upper-class limit.

Here we find the upper-class limit. So, we can add 0.5 to the upper-class limit.

Therefore, the upper-class limit of an inclusive form is 25+ 0.5 = 25.5.

Problem 2:

Find the actual upper-class limit value, lower-class limit, and mid-value of the class interval 10- 15, 16- 20, 21- 25, 26- 30, 31- 35?

Solution:

Given the class interval 10- 15, 16- 20, 21- 25, 26- 30, 31- 35

Now we can find the values of upper-class limit, lower-class limit, and mid-value (or) class mark.

The  Actual lower class limit value is 10.

The  Actual upper-class limit value is 35.

Now, we can find the mid-value or class mark,

We know the formula of class mark i.e,

Class Mark = ½ (upper-class limit + lower class limit)

Substitute the upper-class value and lower class value in the above formula, we get

Class Mark = ½ (35 + 10)  = ½ (45)

Class Mark = 22.5

Therefore, the mid value is 22.5

FAQ’S on Class Limits in Exclusive and Inclusive Form

1. What is a class limit?

Class limit is defined as the minimum value and the maximum value of the class interval may be contained.  The maximum value in the class is known as the Upper-class limit whereas the minimum value in the class is known as the Lower class limit.

2. Define Range?

The difference between the maximum value of observation and the minimum value of observation is called Range.

3. Define Class Mark?

The classmark is defined as the average of upper-class limit and lower class limit, the formula of classmark is,

Class Mark = ½ (upper-class limit + lower class limit)

4. What are the full forms of LCL and UCL?

LCL means Lower Class Limit and UCL means Upper-Class Limit.

5. What is meant by the Inclusive Form of Class Limit?

The inclusive form is defined as when the lower class limit and the upper-class limit are included, then it is an inclusive class interval. These are obtained by subtracting 0.5 from the lower class limit and adding 0.5 to the upper-class limit.

Comparison of One Digit Numbers

Comparison of One Digit Numbers – Definition, Examples | How to Compare 1 Digit Numbers?

Here you can have knowledge about one-digit numbers, examples of one-digit numbers, comparison of one-digit numbers. How to arrange numbers in ascending order and descending order. Check the solved examples on comparison of one-digit numbers. You can have a better understanding of this concept by going through this entire article.

Also, Check:

One-Digit Number – Definition

One-Digit Number has only One Digit. Of all the One-Digit Numbers 1 is the smaller one-digit number and 9 is the greatest one-digit number. There are 10 One-Digit Numbers in Decimal System including 0.

For Example 1,2,3,4,5,6,7,8,9 are one-digit numbers.

How to Compare One-Digit Numbers?

We can compare numbers depending on their values. value of a number is found by adding place values of the digits. we can find the value of the One-Digit Number by its place or face value. The place value or face value of a one-digit number is the same.

The number which has a greater face or place value is greater than the number which has a smaller face value. Greater than symbol is > and less than symbol is <.

Comparison of One-Digit Numbers Examples

8>6

8 is greater than 6

7>2

7 is greater than 2

9>5

9 is greater than 5

6>5

6 is greater than 5

7<9

7 is less than 9

We also know 3<9 or 9>3

The value of 9 is greater than 3

The value of 3 is less than 9

similarly 5<8 or 8>5

The value of 8 is greater than 5

The value of 5 is less than 8

One-Digit Number is always smaller than Two-digit, Three-digit, Four-digit Number, etc. For Example

3<10 or 10>3

One-Digit Number is 3.

Two-Digit Number is 10.

One-Digit Number 3 is less than Two-Digit Number 10.

5<100 or 100>5

One-Digit Number is 5.

Three-Digit Number is 100.

One-Digit Number 5 is less than Three-Digit Number 100.

Numbers can be arranged in two ways. i.e. 1.Ascending Order 2.Descending order.

Arranging 1 Digit Numbers in Ascending Order

In ascending Order, numbers are arranged from smaller to larger. i.e. smaller numbers come first and then larger numbers.

For Example Arrange the digits 1, 7, 3, 5, 9, 6 in Ascending Order

The numbers arranged in ascending order are 1, 3, 5, 6, 7, 9.

Arrange the digits 2,5,7,3,8,9 in Ascending Order

The numbers arranged in ascending order are 2, 3, 5, 7, 8, 9.

Arranging 1 Digit Numbers in Descending Order

In Descending Order, numbers are arranged from larger to smaller. i.e. larger numbers come first and then smaller numbers.

For Example Arrange the digits 1, 7, 3, 5, 9, 6 in Descending Order

The numbers arranged in descending order are 9, 7, 6, 5, 3, 1.

Arrange the digits 2,5,7,3,8,9 in Descending Order

The numbers arranged in descending order are 9, 8, 7, 5, 3, 2.

FAQ’s on Comparing 1 Digit Numbers

1. Is the Face value or place value of one-digit numbers the same?

The face value or place value of one-digit numbers are the same.

2. What is the face value of 7?

The face value of 7 is 7.

3. How one-digit numbers are compared?

One-digit numbers are compared by using face values. The number which has a greater face value or place value is greater than the number which has a lesser face or place value.

4. How many ways one-digit numbers can be arranged?

One-digit numbers can be arranged in two ways i.e. Ascending Order and Descending order.

5. What is the symbol of greater than?

The symbol of greater than is >.

6. What is the symbol of less than?

The symbol of less than is <.

Four Digit Numbers in Numerals and Words

Four Digit Numbers in Numerals and Words | How to Read and Write Four Digit Numbers?

On this page, we will discuss all about Four-Digit Numbers such as writing them in numerals and words. Check out how 4 digit numbers can be written both in short form and expanded form in the later sections. Refer to the solved examples on writing four-digit numbers in both numerals and words. Go through the complete article to have a complete idea of the entire concept of four-digit numbers.

Also, Read: Reading and Writing Large Numbers

Four Digit Numbers – Definition

Four Digit Numbers have four digits. Digits are positioned from right to left at one’s place, ten’s place, hundred’s place, and thousand’s place. The first four-digit number is 1000. The next 9000 numbers are all four-digit numbers, for example, 2465,6789, etc.

How Four-Digit Numbers are Formed?

When we multiply a unit digit with 1000 four-digit numbers are formed. For every Four-Digit Number, the fourth digit from the left represents thousands places, the third digit represents hundreds, the second digit represents tens, and the first represents ones. we can have a four-digit number by adding one to the largest three-digit number. For example: 9834, 2753, 5900.

For example: In the four-digit number 8673

3 is at the unit/one’s place having its value 3 × 1 = 3
7 is at ten’s place having its value 7 × 10 = 70
6 is at hundred’s place having its value 6× 100 = 600
8 is at the thousand’s place having its value 8 × 1000 = 8000
So, 8673 = 8000 + 600 + 70 + 3
8673 is the short form whereas 8000 + 600 + 70 + 3 is the expanded form.

It is read as ‘Eight  Thousand Six Hundred Seventy-Three’.

A comma is marked in Four-digit numbers in numerals before writing the three digits from the right. The digit of thousands is at the left. Since Four-Digit Numbers are longer, the comma helps us to make the number more readable.

As in 7682, a comma is marked before 682, the only digit left is 7, whose value is 7000. The number will be written in numerals as 7682 and written in words as seven thousand six hundred eighty-two.

We can write Four-digit numbers in three ways i.e., numbers in numerals, numbers in words, and numbers in expanded form.

Consider an example 5678 and see how we can write numbers in numerals, numbers in words, and numbers in expanded form.

Number in numerals: 5,678

Number in words: Five thousand six hundred seventy-eight

Numbers in Expanded Form: 5000 + 600 + 70 + 8

4-Digit Numbers in Numerals and Words Examples

Some examples of  four-digit numbers in numerals and words and in expanded form are given below

(i) 5,847

5847 in words – Five thousand eight hundred forty seven

5847 in Expanded Form – 5000 + 800 + 40 + 7

(ii) 6,234

6234 in words: Six thousand two hundred thirty four

6234 in expanded form: 6000 + 200 + 30 + 4

(iii) 9,163

9163 in words: Nine thousand one hundred sixty three

9163 in expanded form: 9000 + 100 + 60 + 3

(iv) 2,645

2645 in words: Two thousand six hundred forty five

2645 in expanded form: 2000 + 600 + 40 + 5

(v) 9,999

9999 in words: Nine thousand nine hundred ninety nine

9999 in expanded form: 9000 + 900 + 90 + 9

(vi) 8,003

8003 in words: Eight thousand and three

8003 in expanded form: 8000 + 000 + 00 + 3

(vii) 6,302

6302 in words: Six thousand three hundred two

6302 in expanded form: 6000 + 300 + 00 + 2

(viii) 2,541

2541 in words: Two thousand five hundred forty one

2541 in expanded form: 2000 + 500 + 40 + 1

(ix) 7,301

7301 in words: Seven thousand three hundred one

7301 in expanded form: 7000 + 300 + 00 + 1

(x) 1,738

1738 in words: one thousand seven hundred thirty eight

1738 in expanded form: 1000 + 700 + 30 + 8

(xi) 3,001

3001 in words: Three thousand and one

3001 in expanded form: 3000 + 000 + 00 + 1

(xii) 5,005

5005 in words: Five thousand and Five

5005 in expanded form: 5000 + 000 + 00 + 5

(xiii) 1,405

1405 in words: One thousand four hundred five

1405 in expanded form: 1000 + 400 + 5

(xiv) 3,333

3333 in words: Three thousand three hundred thirty three

3333 in expanded form: 3000 + 300 + 30 + 3

(xv) 6,724

6724 in words: Six thousand seven hundred twenty four

6724 in expanded form: 6000 + 700 + 20 + 4

(xvi) 8,888

8888 in words: Eight thousand eight hundred eighty eight

8888 in expanded form: 8000 + 800 + 80 + 8

These are the examples of four digits written and explained on how to identify the place value in a four-digit number in numerals, words and in expanded form.

FAQ’s on Four Digit Numbers

1. What is the expanded form of 6789?

The expanded form of 6789 is 6000+700+80+9.

2. How four-digit numbers are formed?

Four-digit numbers are formed by multiplying 1000 with units digit.

3. What is the place value or face value of 7 in 9786?

Face value or place value of 7 in 9786 is hundred.

4. What is the greatest four-digit number?

The greatest four-digit number is 9999.

5. What is the smallest four-digit number?

The smallest four-digit number is 1000.

Conversion of Roman Numerals to Numbers

Conversion of Roman Numerals to Numbers – Rules, Examples | How to Convert Roman Numerals to Numbers?

Find a way for converting Roman Numerals to Numbers. You can learn about the basic details such as Roman Number Definition, Procedure for Converting Roman Numerals to Numbers. You can also check the solved Examples on how to change Roman Numerals to Numbers by going through this article completely.

Do Check:

Roman Numerals – Definition

Romans used some roman alphabets to specify numbers. These are called Roman Numerals. Roman Numerals are nothing but English alphabets except j, u, and w. There are seven Roman numerals. Roman Numerals are I, V, X, C, L, D, and M. Bar on the Roman letters means its value is multiplied by 1000 times. The values of Roman Numerals are as follows

Commonly Used Roman Numeral Symbols and their Equivalent Numbers
I=1 V=5
X=10 C=100
L=50 D=500
M=1000

Roman Numeral Chart for 1 to 1000 Numbers

Roman Numerals for 1-1000 Numbers

How to Convert Roman Numerals to Numerals?

For a given roman numeral r

  • Find the largest roman numeral(n) with the large decimal value(v) taken from the  roman numeral r:
Roman Numeral(n) Decimal Value(v)
I 1
v 5
IX 9
X 10
XL 40
L 50
XC 90
C 100
CD 400
D 500
M 1000
  • If the largest numeral appears first then count how many times it appears. It appears a Maximum of three times. Multiply its value by the number of times it appeared. The value V of the roman number is added to the decimal number x.
  • If the largest numeral appears second then subtract the value of the numeral before it from its value. The value v of the Roman Numeral is added to the decimal number X.

X=X + V

  • Repeat steps 1 to 3 until you find Roman Numerals of r.

Roman Numerals to Numbers Conversion Examples

1. Convert the roman numeral XXXVII to Number?

Solution:

In this example, Highest Roman Numeral is X. Roman Numeral X appeared three times. The value of X multiplied by three times. So the decimal number (X) has 30. The Second highest decimal number is V and its value is 5 and it is added to the decimal number. I is appearing two times and its value is 1 and it is added to a decimal number(X). Therefore, the given roman number XXXVII converted to numbers is 37.

Iteration Highest Roman Numeral(n) Highest Decimal value(v) Decimal Number(X)
I X 10 10
2 X 10 20
3 X 10 30
4 V 5 35
5 I 1 36
6 I 1 37

2. Convert Roman Numeral MMXXI to Number?

Solution:

In this example, Highest Roman Numeral is M. Roman Numeral M appeared two times. The value of M multiplied by two times.so the decimal number X has 2000. Second, the highest decimal number is X and its value is 10 and it appeared two times. Its value is added to the decimal number. Now decimal number(X) has 2020. I appear one-time. Its value is 1 and it is added to the decimal number. Thus given number MMXXI converted to Numbers is 2021.

Iteration Highest Roman Numeral(n) Highest Decimal Value(v) Decimal Number(X)
I M 1000 1000
2 M 1000 2000
3 X 10 2010
4 X 10 2020
5 I 1 2021

3. Convert Roman Numeral CDLII to Number?

Solution:

In this example, Highest Roman Numeral is D. It appeared second of the Roman Numeral, so subtract the value of the Roman Numeral before its value.  so the decimal number( X) has 400. Roman Numeral L has the decimal value 50 and it is added to a decimal number(X). The value of I is 1 and it is added to a decimal number. The given number is 451.

Iteration Highest Roman Numeral(n) Highest Decimal value(v) Decimal Number(X)
I D 500 500
2 c 100 400
3 L 50 450
4 I 1 451
5 I 1 452

4. Convert Roman Numeral CCCL to Number?

Solution:

In this example, Highest Roman Numeral is c. Roman Numeral C appeared three times. The value of X multiplied by three times. So the decimal number X has 300.second highest decimal number is L. Its value is 50 and it is added to a decimal number(X). The given number CCCL is 350.

Iteration Highest Roman Numeral(n) Highest Decimal value(v) Decimal Number(X)
I C 100 100
2 C 100 200
3 C 100 300
4 L 50 350

FAQ’s on Conversion of Roman Numerals to Numbers

1. What is the value of XLVI?

Here the largest value of the Roman Numeral is L. since it is placed second the value of the L numeral is subtracted from first. So the total is 40. The values of V and I are added to the total. The value of XLVI is 46.

2. What is the value of L in Roman Numerals?

The value of L in Roman Numerals is 50.

3. Why bar is placed on the Roman Numeral?

when a bar is placed on the roman numeral its value is increased by 1000 times.

4. What is the value of M?

The value of M is 1000.

Use of Tally Marks

Use of Tally Marks – Definition, Charts, Counting, Examples | How to Represent Numbers in Tally Marks?

Tally marks are most ordinarily used to represent the scoreboard in games and sports. The frequency of knowledge is often represented using Tally Marks. Tally Marks are also called Hash Marks. It is denoted by a single vertical bar ‘ | ‘. You may use the tally for solving addition, subtraction, or word problems. Before numbers were invented people found it difficult to stay records of their belongings and then they used to count by sticks which are further referred to as Tally Marks.

Read More: Frequency Distribution of Ungrouped and Grouped Data

Tally Marks – Definition

Tally marks are defined as a way to record or mark your counting. It is a numeral system used to make counting easier. The general way of tally marks writing may be a group or set of 5 lines, in these five lines first four lines are drawn vertically and each fifth line runs diagonally over the four vertical lines it means from the top of the first line to the bottom of the fourth line.

Tally marks are commonly used for counting the points, scores, many people like that, these tally marks will differ from country to country because each country has developed with their own system. The tally marks are expressed as shown below

Counting Tally Marks

Let us see how to use tally marks for counting numbers 1 to 10. Tally marks are the quickest way of keeping track of numbers during a group of five.

How to represent the numbers in Tally Marks?

  • One is represented by ‘I’
  • Two is represented by ‘II’
  • Three is represented by ‘III’
  • Four is represented by ‘IIII’
  • Five is not represented by ‘IIIII’, it is represented as four vertical lines and one cross line (diagonal line) it means from the top of the first line to the bottom of the fourth line.
  • Six is represented by a set of five lines with ‘I’
  • Seven is represented by the set of five lines with ‘II’
  • Eight is represented by the set of five lines with ‘III’
  • Nine is represented by the set of five lines with ‘IIII’
  • Ten is represented by 2 (two) sets of five lines.

Tally Mark Chart

Tally charts are used to collect the data efficiently and quickly. A Tally Mark chart or a Tally Mark graph is a graphical representation of data in statistics, so it is beneficial in scanning the data. A tally chart filling with marks is represented by numbers is quicker than writing out figures or words, then the information is collected into sub-groups, making it easy to research.

In a tally mark graph has first four numbers lines are represented by vertical lines and the fifth line is represented by a diagonal (/) line across the four vertical lines. The tally marks chart contains the number from 1 to 10 is as shown below,

Tally Marks are used for finding the frequency of the set of data values specifically for the raw data or ungrouped data. consider an example, asked to create the frequency distribution provided with raw data or random values. In this case, we may have to make either for class intervals or individual observations.

Now, we count all occurrences of a single data value or a class interval in one go, then we have to cross-check the entire list again and again for the next class interval or individual observation. Therefore this will be taking a lot of time for finishing. So, we can be reducing the complexity by making use of tally marks. The entire process can be done just by adding tally marks for each class interval or different observations.

Thus, we’ve to traverse the whole list of given data set on one occasion and then write the frequency numbers by counting the tally marks after completing the identification. So the obtained table is defined as the frequency distribution of the given data. The below example on tally marks will help you to understand the concept in a better way.

Tally Marks Examples

Example 1:

Below given the marks of 35 students on the Maths test (out of 10). Arrange those marks in tabular form using tally marks?

6, 1, 7, 8, 10, 9, 4, 2, 3, 7, 1, 8, 7, 5, 1, 4, 7, 6, 5, 2, 3, 8, 2, 4, 6, 2, 9, 3, 1, 4, 5, 7, 5, 10. Find the  

  1. How many students scored more than 8 marks?
  2. How many students scored less than & equal to 5?
  3. What are the marks scored by the maximum students? what is the number of students?

Solution:

Given the marks of 35 students in Maths test. The frequency table of given data is as shown below

             Marks             Number of students (Frequency)             Tally Marks
1                                        4                    IIII
2                                        4                   IIII
3                                        3                   III
4                                        4                   IIII
5                                        4                   IIII
6                                        4                   IIII
7                                        4                   IIII
8                                        3                    III
9                                        3                    III
10                                        2                     II
 Total                                       35

(i) Given the 35 students’ marks out of 10 in the maths test.

Now, we can find the number of students with more than 8,

The number of students with more than 8 marks is, 3 + 2 = 5

Therefore the total number of students with more than 8 marks is 5.

(ii) Given the 35 students’ marks out of 10 in the maths test.

Now, we can find the number of students who scored less than and equal to 5.

The number of students who scored less than and equal to 5 is,

= 4 + 4+ 3+ 4 + 4

= 19

Therefore, the number of students who scored less than and equal to 5 is 19.

(iii) Given the 35 students’ marks out of 10 in the maths test.

Now, we can find the maximum number of students who scored 5 marks.

The maximum number of students who scored 5 marks is 5.

The maximum number of students scored 5 marks. The number of students is 5.

FAQ’S on Tally Marks

1. What is Tally Mark Chart?

Tally Mark charts are used to collect the data efficiently and quickly. A Tally Mark chart is a graphical representation of data in statistics, so it is beneficial in scanning the data. A tally chart filling with marks is represented by numbers is faster than writing out figures or words, then the data is collected into sub-groups, making it easy to analyze.

2. Define Tally Frequency Table?

The Tally Frequency table is defined as a method of collecting the data with the tally marks, tally frequency table is also known as Tally Chart.

3. Why should Tally marks be essential?

Tally marks are very important mainly use to keep the record of a running or continuous count. These tally marks are so useful for maintaining and recording the scores in a game or a sport.

5. What are the advantages of Tally Marks?

The advantages of tally marks are

  1. Enables Effortlessness in data movements
  2. Fewer expenses on data collection and data transfer of files.
  3. Helps for easy and fast documents access.
Frequency Distribution of Grouped and Ungrouped Data

Frequency Distribution of Ungrouped and Grouped Data – Definition, Table, Formula, Examples

To learn more about the Frequency Distribution of Grouped data and Ungrouped data this is the right place to learn, and to increase more knowledge on Frequency Distribution. Statistics is the study of collecting data, organization, interpretation, analysis, and data presentation. The main purpose of statistics is to plan the collected data in terms of the experimental designs and statistical surveys.

Statistical knowledge will help to collect the data in the proper method, and samples are employed in the correct analysis process, in order to effectively produce the results. In statistics, the Frequency distribution is a table that displays the number of outcomes of a sample. In this platform, we have to learn about Frequency Distribution definition, ungrouped data, grouped data advantages, and disadvantages.

Also, Read: Terms Related to Statistics

What is Frequency Distribution?

A frequency distribution can be defined as the tabulation of the values with one or more variables. A frequency distribution is a representation, either in a graphical format or tabular format, that displays the number of observations within a given interval. The interval size will depend on the data being analyzed and the goals of the analyst. The intervals must be mutually exclusive and exhaustive.

Basically, the Frequency distribution is typically used within a statistical context. A frequency distribution can be graphed as a histogram (or) pie chart. Frequency distributions are particularly useful for normal distributions, which show the observations of probabilities divided among standard deviations.

The tabular form of Frequency Distribution of statistics is shown below

Frequency Distribution of Grouped Data

Grouped data means the data or information given in the form of class intervals. This information can also be displayed using a pictograph or a bar graph.  Grouped data plays an important role when we have to deal large information or data. Arranging the individual observations of a variable into groups, so that the frequency distribution table of these groups provides a convenient way of summarizing or analyzing the data is termed grouped data.

The advantages of Frequency distribution grouped data are:

  • It improves the accuracy and efficiency of estimation.
  • It helps to focus on the important subpopulations and ignores irrelevant ones.

The disadvantages of grouping data are:

  • Lose some of the details in the data.
  • we cannot accurately calculate statistics such as the mean or median from a grouped data of frequency table is alone

Frequency Distribution Table of Grouped Data:

The frequency distribution of grouped data is to analyze when the collected data is large, we can follow this approach to analysed it easily. It is named tally marks.

Example of Frequency Distribution Grouped Data: 

Consider the marks of 30 students of class VII obtained in an examination. The maximum marks of the exam are 50.

24, 6, 12, 17, 33, 45, 16, 7, 24, 28, 11, 31, 23, 40, 39, 16, 26, 9, 16, 20, 31, 25, 28, 18, 15, 33, 28, 47, 43, 21.

So, if we create a frequency distribution table for each and every observation, then it will form a large table. For easy understanding, we can make a table with a group of observations say that 0 – 10, 10 – 20, 20 – 30, 30 – 40,   40 – 50, and so on. We can form the data like the above table, easily understanding and faster-doing the calculation.

The distribution obtained in the above table is known as grouped data of frequency distribution. In that tabular form mention the data or marks in between 10 – 20, suppose 3 numbers will be there then the frequency is 3 like that you can counting or calculated the intervals, frequency will be noticed. But 20 will appear in both 10 to 20 and 20 to 30, 30 also will appear in both 20 to 30 and 30 to 40. But is not feasible that observation either 10 or 20 belong to two classes concurrently.

To avoid this inconsistency, we choose the rule that the general conclusion will belong to the higher class. It means that 10 belongs to the class interval 10-20 but not to 0-10, similarly 20 belongs to class interval of 20-30 but not to 10-20. This is how we create a frequency distribution table of grouped data.

Frequency Distribution of Ungrouped Data

Frequency Distribution of ungrouped data is a data given as individual data points. An ungrouped set of data is basically a list of numbers. Ungrouped data does not fall in any group, it still raw data.

The advantages of ungrouped data frequency distribution are :

  • Most people can easily interpret it.
  • When the sample size is small, it is easy to calculate the mean, mode and median.
  • It does not require technical expertise to analyze it.

Frequency Distribution Table of Ungrouped Data

The data is raw that means it cannot sorted in to categories, classified, or otherwise grouped. An ungrouped set of data is basically a list of numbers. The ungrouped data of frequency distribution table is as shown below,

The following rules must be completed in order to create an ungrouped data frequency distribution :

  1.  Set the values of data, which are called scores, in the column starting from the lowest value to the highest or vice versa.
  2. Create the second column with the frequency of each data occurrence. This column is known as the tally of the scores.
  3.  Create the third column, where the relative frequency of each score will be inserted. The relative frequency can be obtained as follows: fr = f/N, where f is the frequency of each score from the second column and N is the total number of scores. In order to check the correctness of calculations, the sum of fr should be calculated and should be equal to 1.
  4. The next column, where the relative frequency will be performed in percentages, is to be created.
  5. In the next column, known as the cumulative frequency column, the cumulative frequency for each score should be estimated. Calculation of the cumulative frequncy should be started from the lowest value of score, for which the cumulative frequency equals the value of frequency from the second column.
  6. The further calculations are to be performed for each score in a sequence from lowest to highest and the cumulative frequency for each next score equals to the sum of the cumulative frequency of the previous score and frequency of this score from the second column. The cumulative frequency of the highest score should be equal to the total number of scores.
  7.  The next column is called “cumulative proportion” and the values of its column are obtained as a ratio of cumulative frequency for each score and the total number of scores.
  8.  The last column is the cumulative percent, where the cumulative proportion is presented as percentages.

Difference between Grouped Data and Ungrouped Data

Based on Classification, Accuracy, Summarization of grouped data and ungrouped data difference are listed below:

  • Classification: Grouped data is organized into forms whereas Ungrouped data has no forms of organisation.
  • Accuracy: Grouped data has higher accuracy levels when calculating mean and median, whereas ungrouped data has less accurate in determining the mean and median.
  • Preference: Grouped data preferred the analyzing data whereas ungrouped data preferred the collecting data.
  • Summary : Grouped data is summarised in a frequency distribution, while the ungrouped data has no summarization.
  • The representation of grouped data and ungrouped data of frequency distribution is as shown below:


Terms Related to Statistics

Commonly Used Statistics Terms | Defintions of Basic Statistical Terms with Examples

Statistics is a method of collecting data and summarizing the data. The study of the collection, analysis, interpretation, presentation, and organization of data is called Statistics. Now a days Statistics is very important because today we live in the information world and much of this information is determined mathematically by Statistics. The statistics concept is necessary for informing correct data. Go through the entire article to be well versed with Statistical Terms and Concepts along with Examples.

Also, Read: Real Life Statistics

Statistical Terms and Definitions

The various terms related to statistics such as Data, Mean, Mode, Raw data, Observation, Array, Range are explained clearly. Let us discuss them in detail by considering few examples.

Data

Statistical refers to the set of numerical facts collected for the purpose of an investigation is called Statistical data. There are two types of statistical data,

  1. Primary Statistical data
  2. Secondary Statistical data

The data can be about population, birth, death, the temperature of place during a week marks scored in the class runs scored in different matches, etc.

Primary Statistical Data: The data which are naturally obtained by the investigator himself for the first time for his own use is called Primary Statistical data. Primary data also called First Handed Data.

Secondary Statistical Data: The data which was collected by someone with the help of primary data is called secondary data, which is artificial in nature. Secondary Statistical data is also called Second Handed Data in nature. They are two types of Secondary Statistical Data,

  1. Raw data (or) ungrouped data.
  2. Array

Example:  

The below table is an example of statistical data, in this, the data will be regarding the number of students opting for different subjects like English, Maths, Science, Social.

Subjects English Maths Science Social
No. of students 25 30 40 20

Based on the above table, we can easily calculate the total numbers of the students, average of the students. Therefore the total number of students is 115. If we want to calculate two subjects total then we can add that two subjects student numbers.

Raw Data (or) Ungrouped Data

Raw data is also called ungrouped data. These types of data are obtained in their original form. When some information is randomly and presented is called Raw Data.

Example: 

The example of Raw data (or) ungrouped data is given below. The students in class VII A are 15 and marks obtained by them out of 25 in the English Test. Based on the given data we can know each student’s marks, this means a student is one data and marks is another data we are knowing the marks based on the student. In some marks will be given more students but student strength gives less at that time we are comparing both then choose the predict or collect values.

Given the marks (out of 25) obtained by 15 students of class VII A in English in a test.

16, 13, 20, 21, 15, 25, 14, 19, 10, 20, 22, 12, 18, 15, 23

Array

Generally, Arrays are the data that are put in the form of a table which is also called the presentation of data. simply, Array refers to the arrangement of data in ascending or descending of data order. If the number of times an observation occurs, then it is called frequency distribution. Array data is also called Arrayed data.

Example:

In this example, the main concept is array is putting the raw data in ascending order or descending order. The below data is given, we can arrange them in ascending order,

Given data is 12, 10, 10, 12, 8, 3, 7, 2, 17, 20, 15

The given data is arranged in ascending and represented as,

2, 3, 7, 8, 10, 10, 12, 12, 15, 17, 20

Observation

The observation is defined as every entry is collected as a numerical fact in the given data. In other words, an observation in statistics means a value of something of interest you are measuring or counting during a study or experiment ‘like a person’s height, a bank account value at a certain point in time, or a number of animals like that. The observation unit measures the same thing in the context.

For example, let’s say you are measuring how well your savings perform over the period of one year. You record one measurement that is your bank account balance for every three months for a total.

Range

Statistics Range means the difference between the highest value and the lowest value of the observation is called the range of the data. In other words, statistics the range of a set of data is the difference between the largest and smallest values. The formulae of Range is,

Range (X) = Max(X) – Min(X)

The above range formula is used for calculating the same value, the minimum range is subtracted from the maximum range value to get the Range Value. X is denoted as the value of data.

Example:

In an exam, the highest marks obtained are 20 and the lowest marks are 5 then what is the range?

Highest marks obtained = 20

Lowest marks obtained = 4

Range (X) = Max(X) – Min(X)

Therefore, range = highest marks – lowest marks = 20 – 5 = 16

Another example is, in {4, 6, 9, 3, 7} the lowest value is 3, and the highest is 9, so the range is 9 − 3 = 6.
The range can also mean all the output values of a function.

Mean

Mean and mode is used to measure the central tendency. Mean is defined as the average or the most common value in a collection of numbers. The mean or average of a data set is found by adding all numbers in the data set and then dividing by the number of values in the set.

If x, x1, x3, ……… xn are n observations then
Arithmetic mean = (x1 + x2 + xn, ……………. xn)/n = (∑xi)/n.
∑ is the Greek letter sigma and is used to denote summation.

Mode

In Statistics, the mode is the value that appears most frequently in a data set. A set of data may have one mode, more than one mode, or no mode at all. The mode can be the same value as the mean and/or median, but this is usually not the case.

A Mode in statistics is defined as the value that has a higher frequency in a given set of data. It is the value that appears the most number of times.  Two modes in a given set of data, such values are called Bimodal. A set of numbers with three modes is called Trimodal, and any set of numbers with more than one mode is called Multimodal.

The advantages of mode in statistics are below,

  • The mode is equal to understand and calculate.
  • The mode is not affected by extreme values.
  • The mode is easy to identify in a data set and in a discrete frequency distribution
  • The mode is useful for Qualitative data.
  • The mode can be located graphically.
  • The mode can be computed in an open- Ended frequency table.

Example:

In the following list of numbers, 12 is the mode since it appears more times in the set than any other numbers:

3, 3, 4, 5, 5, 6, 8, 9, 12, 12, 12, 24, 27, 37

Solving Problems on Statistical Terms

Example 1:

The height of 12 girls was measured in cm and the results are as follows:

149, 144, 126, 138, 145, 130, 145, 150, 133 ,129, 131, 151

(i) What is the height of the tallest girl?

(ii) What is the Height of the shortest girl?

(iii) What is the range of data?

Solution:

Given the 12 girls heights in cm

To finding the tallest girl height and shortest height and range.

(i) The height of the tallest girl is 151 cm

(ii) The height of the shortest girl is 126

(iii) We know the Range Formula,

Range (X) = Max (X) – Min (X )

Substitute the given values in above formula, we get

Range = 151 cm – 126 cm

= 25 cm

Therefore, Range = 25 cm.

Example 2:

Find the Mean of the given data

5, 6, 9, 10, 15, 17, 19, 20, 25, 30

Solution :

Given the data is 5, 6, 9, 10, 15, 17, 19, 20, 25, 30

Now, we can calculate the Mean

Mean = Total sum / no. of terms

Mean = 156 / 10 = 15. 6

Therefore, the Mean of a given data is 15.6

Example 3:

Find the Mode of a given data.

3, 3, 5, 6, 13, 15, 15, 19, 20 , 15

Solution:

Given the data is 3, 3, 5, 6, 13, 15, 15, 19, 20, 15

Now, we are finding the Mode of a given data.

Mode means the value that has the higher frequency in a given set of data.

In this given data the higher frequency data is 15.

Therefore the Mode of a given data is 15.

Real Life Statistics

Real Life Statistics – Definition, Types, Advantages, Applications, Examples

Statistics is more important because nowadays we live in the information world and much of this information is determined mathematically by statistics. It helps to use the proper methods to collect the data, employ the correct analyses, and effectively present the results. Basically, statistics is a mathematical discipline to collect data and summarize the data. The study of statistics is the collection, analysis, interpretation, presentation, and organization of data. Check out Statistics Definition, Types, Advantages, Applications, and Examples in the later sections.

Statistics Definition

The main purpose of statistics is to plan the collected data in terms of the experimental designs and statistical surveys. The study of the collection, analysis, interpretation, presentation, and organization of data is called statistics. It will be collecting the data and summarizing the data. If it is studying the population of the country or its economy statistics are used for all such data analysis. Statistics has many applications from small scale to large scale.

Statistics basics including the measure of central tendency and the measure of dispersion. Mean, Median and Mode are central tendencies whereas dispersion comprises variance and standard deviation. Statistics used in many sectors such as psychology, geology, sociology, weather forecasting, probability, and much more. The scope of statistics helps in economic planning, business management, administrations, and research.

Characteristics of Statistics

  • Statistics are aggregate facts.
  • Statistics are numerically expressed.
  • Statistics are collected in a systematic manner.
  • Statistics for a predefined purpose.
  • Statistics are enumerated or estimated according to reasonable standards of Accuracy.
  • Statistics are capable of being placed in relation to each other.

Types of Statistics

Statistics are of two types

  1. Descriptive Statistics
  2. Inferential Statistics

Descriptive Statistics: It provides the tool to define our data in a most understandable and appropriate way, the collection of data is described in summary. Descriptive statistics are used on a large scale.

Inferential Statistics: It is about using the data from the sample and then making inferences about the larger population from which the sample is drawn. Inferential statistics are used to explain the descriptive one, it will also be used on a large scale.

Descriptive statistics are transitioned into inferential statistics, it is one more type of statistics.

Representation of Statistics Data

Bar charts, histograms, pie charts, and box plots (box and whiskers plots). Two common types of graphic displays are bar charts and histograms. Both bar charts and histograms use vertical or horizontal bars to represent the number of data points in each category or interval.

Some of the methods involve collecting, summarizing, analyzing, interpreting variables of numerical data. The methods are provided below for representing statistics data.

  • Data Collection
  • Data Summarization
  • Statistical Analysis

In this, the data is a collection of facts, such as numbers, words, measurements, observations, etc. Data are two types is Qualitative data and the second one is Quantitative data. Descriptive data is called Qualitative data whereas Numerical data is Quantitative data, again it has two types.

  1. Discrete data
  2. Continuous data.

Discrete data is in form of digital that means zero’s and ones, it has a particular fixed value. so, discrete data can be counted whereas continuous data is not counted because it won’t have a particular fixed value but continuous data has a range of data, so it can be measured.

The representation of statistics data as follow :

Pie Chart: Pie charts are used in data handling and are circular charts divided up into segments that each represent a value. Pie charts are divided into sections or slices to represent a value of different sizes. The pie chart has different parts are Title, Legend, Source, and data. The title offers a short explanation of what is in your graph and legend tells what each slice represents, source explains where you found the information that is in your graph.

Pie Chart

Bar Graph: A bar graph is a chart that plots data using rectangular bars or columns called bins, that represents the total amount of observations in the data for that category. Bar graphs are commonly used in financial analysis for displaying data. In other words, Bar graphs are used to compare things between different groups or to track changes over time.

Bar Graphs are three types :

  1. Horizontal Bar Graphs
  2. Vertical Bar Graphs
  3. Line Graph

Bar Graphs have different parts such as Title, Source, X-Axis, Y-Axis, Data, and Legend.

Line Graph: Line graphs or line charts are used to track variations over time, which may be long-term or short-term. We can also use line graphs to compare changes over the same period for more than one group. There are 3 main types of line graphs in statistics namely, a simple line graph, multiple line graph, and a compound line graph. Each of these graph types has different uses depending on the kind of data that is being evaluated.


Line Graph Data RepresentationPictogram:  A Pictogram is one of the simplest and most popular forms of data visualization out there. Also known as “pictographs”, “icon charts”, “picture charts”, and “pictorial unit charts”, pictograms use a series of repeated icons to visualize simple data.

Pictograms 
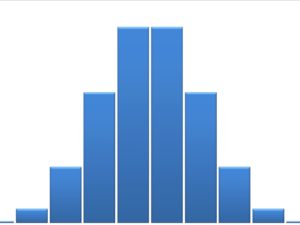
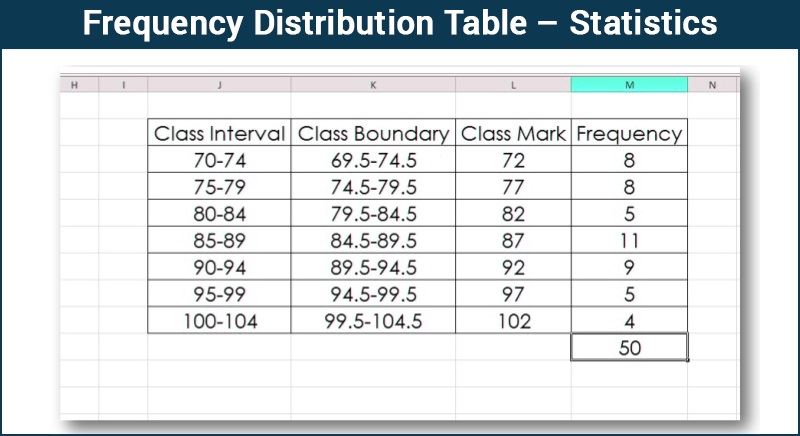
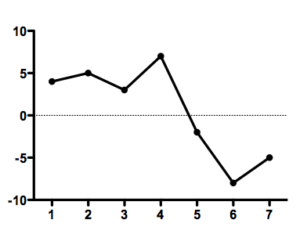
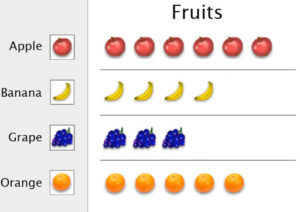
Histogram: A histogram is a display that indicates the frequency of specified ranges of continuous data values on a graph in the form of immediately adjacent bars. Interval is a range of data in a data set. The different types of a histogram are uniform histogram, symmetric histogram, bimodal histogram, probability histogram.


Histogram

Frequency Distribution: Frequency distribution in statistics is a graph or data set organized to show the frequency of occurrence of each possible outcome of a repeatable event observed many times. The frequency of a data value is represented by ‘f’. There are three types of frequency distributions:

  1. Grouped Frequency distribution.
  2. Ungrouped Frequency distribution.
  3. Cumulative Frequency distribution.
  4. Relative Frequency distribution.
  5. Relative cumulative Frequency distribution.

FAQ’s on Real Life Statistics

1. What are the applications of Statistics?

A. Some of the applications of Statistic are listed below :

  1. Statistics applied to Theoretical Statistics and Mathematical Statistics
  2. Statistics in society
  3. Statistical computing
  4. Machine learning and data mining.

2. How many types of Statistics, namely?

Statistics are two types, namely

  1. Descriptive Statistics
  2. Inferential Statistics

3. What is Statistics?

The study of the collection, analysis, interpretation, presentation, and organization of data is called statistics.

4. What are the types of Bar Graphs?

Bar graphs are commonly used in financial analysis for displaying data. Bar graphs are used to compare things between different groups or to track changes over time. There are 3 types of bar graphs namely:

  1. Horizontal Bar Graphs
  2. Vertical Bar Graphs
  3. Line Graph

5. How to represent data on Statistics?

In Statistics, the data can be represented by using pie charts, bar graphs, histograms, pictograms, line graph,s and frequency distribution. Data will be two types one is qualitative and another one is quantitative. Descriptive data is called Qualitative data whereas Numerical data is Quantitative data. Again quantitative data has two types those are discrete and continuous.

8 Times Multiplication Table

8 Times Table Multiplication Chart | Learn Table of 8 | Tips & Tricks to Memorize Multiplication Table of 8

If we want to learn a Multiplication Chart of 8 with whole numbers, this is the right place to learn because you will get complete knowledge on 8 Times Table with whole numbers. Some students may feel the 8 Times Multiplication Chart difficult. To help such students we have mentioned the Table of 8 up to 20 both in the image and tabular format for your convenience. Math Tables are necessary at the time of primary schooling, it develops memory skills at your learning stages.

8 Times Table Multiplication Chart

If we want to practice daily the Multiplication Chart of 8 Times Table, you can download an image format, here we will have the image of 8 Times Table. Learn Tips & Tricks to memorize the Table of 8 and here know how to read and write the Table of Eight. You can download the Multiplication Table of Eight images for free and prepare, then you can easily and fastly solve more basic multiplications, division problems.

8 Times Table

How to Read Multiplication of 8?

One time Eight is 8.

Two times Eight is 16.

Three times Eight is 24.

Four times Eight is 32.

Fives times Eight is 40.

Six times Eight is 48.

Seven times Eight is 56.

Eight times Eight is 64.

Nine times Eight is 72.

Ten times Eight is 80.

Table of 8 | Multiplication Table of 8 up to 20

Get the 8 Times Table Multiplication Chart in the tabular form is shown in the below sections and now you get the idea of how to write the 8 table or Multiplication Table of 8. We have given the first 20 multiples of 8 here. This Multiplication Table of 8 Chart is used to perform the arithmetic operations quickly.

8 × 1 = 8
8 × 2 = 16
8 × 3 = 24
8 × 4 = 32
8 × 5 = 40
8 × 6 = 48
8 × 7 = 56
8 × 8 = 64
8 × 9 = 72
8 × 10 = 80
8 × 11 = 88
8 × 12 = 96
8 × 13 = 104
8 × 14 = 112
8 × 15 = 120
8 × 16 = 128
8 × 17 = 136
8 × 18 = 144
8 × 19 = 152
8 × 20 = 160

Why should learn Multiplication Table of 8?

Learning a Multiplication Chart of Eight will help to enhance skills and do the calculation quickly. Solving the mathematical problems will increase the mental arithmetic skills. The Multiplication Tables are the basics or fundamentals in learning Maths.

  • 8 Times Table Multiplication Chart helps to understand the patterns easily.
  • Table of 8 makes you perfect in performing the quick calculations.
  • Learning the Multiplication Table of 8, you can easily solve all the mathematical problems like Multiplications, Divisions.

Get More Math Table Multiplication Charts

1 Times Table Multiplication Chart 2 Times Table Multiplication Chart 3 Times Table Multiplication Chart
4 Times Table Multiplication Chart 5 Times Table Multiplication Chart 6 Times Table Multiplication Chart
7 Times Table Multiplication Chart 9 Times Table Multiplication Chart 10 Times Table Multiplication Chart
11 Times Table Multiplication Chart 12 Times Table Multiplication Chart 13 Times Table Multiplication Chart
14 Times Table Multiplication Chart 15 Times Table Multiplication Chart 16 Times Table Multiplication Chart
17 Times Table Multiplication Chart 18 Times Table Multiplication Chart 19 Times Table Multiplication Chart
20 Times Table Multiplication Chart 21 Times Table Multiplication Chart 22 Times Table Multiplication Chart
23 Times Table Multiplication Chart 24 Times Table Multiplication Chart 25 Times Table Multiplication Chart

Tips & Tricks to memorize Table of Eight

The below tips and tricks are memorize Multiplication of 8 Times Table, mentioned here

  • Multiplication of 8 Times Table is simple and easy to memorize. However, there is a pattern for every five multiples of 8 i.e., 8, 16, 24, 32, 40, 48, 56, 64, 72, 80.
  • You can identify the multiplication sequence being followed by successive multiples of 8.
  • Multiplying any two numbers, the order does not matter the answer should be always the same (if we multiply the first number with a second number or the second number with the first number). Example, 3 x 4 = 12 or 4 x 3 = 12
  • The patterns will help to remember the product of two numbers.
  • Learning the Table of 8 helps you solve mathematical problems easily.
  • Multiples of 8 are multiples of both 2 and 4.
  • If you multiply an even number with 8 the result will be the same even number in the unit digit i.e 8 x 2 = 16, 8 x 6 = 48, 8 x 8 = 64 and so on.

Solved Examples on 8 Times Table

Example 1:

What does 8 x 7 mean?

Solution:

8 x 7 means multiply 8 with 7 or 8 times 7

8 x 7 = 56

In other words, Seven times Eight is 56.

Therefore, 56 is equal to 8 times 7.

Example 2:

A person eats 3 mangoes per day. How many Mangoes will he eat in 8 days?

Solution:

Given that,

The number of mangoes A person eats in a day is 3

The number of mangoes A person eats in 8days is,

8 days = 8 x 3 = 24 ( three times eight is 24)

Therefore, A person eats 24 mangoes in 8 days.

Example 3:

Sunny planned to attend 8 hours of online classes for 4 days. Unfortunately, he wasn’t able to attend one session for 3hours on one particular day. Using the table of 8 find how many hours of sessions has he attended in total classes?

Solution:

Given that,

Plan to attending classes is 8 hours for 4days

Not attended session hours is 3

now, write  the given statement in the form of a mathematical expression, that is

= 8 x 4 =32

Next, 32 – 3 = 29

Therefore, sunny totally attended online classes is 29 hours.

Example 4:

Find the value of 8 times 6 minus 4 plus 3?

Solution:

Given that, the finding value is 8 times 6 minus 4 plus 3

now, finding

= 8 x 6 = 48

next, minus 4 into the above value

48 – 4 = 44

next, add 3 to the above value

44 + 3 = 47

Therefore the value is 47.

FAQ’s on 8 Times Multiplication Table

1. What is Multiplication Table?

Multiplication tables are the list of multiples of the number. In other words, it defines the multiplication operation of the two given numbers.

2. How to remember the maths tables up to 20?

Create a maths tables chart from 2 to 20 and read the chart every day and practice from basic to remember it.

3. What is the trick for multiplying by 8?

First, identify the pattern and then product the first number with the second number or the second number with the first number. You just read it and remember, otherwise there are no other special tricks for 8 Times Table Multiplication. If the multiplying number is an even number then the unit digit of the remains the same that is even number.

4. What is the importance of the Multiplication Table?

The Multiplication Table helps to keep the information at the fingertips to use it whenever required. It helps to enhance skills and increases memory power and calculation speed.

5. What are the factors of 8?

The number which divides the original number evenly is called a factor of 8. When a pair of numbers are multiplied together to produce 8, then they are called pair factors. When 8 is divided by its factor, it results in zero remainders. The factors are 1, 2, 4, and 8.