Engage NY Eureka Math Algebra 1 Module 4 End of Module Assessment Answer Key
Eureka Math Algebra 1 Module 4 End of Module Assessment Task Answer Key
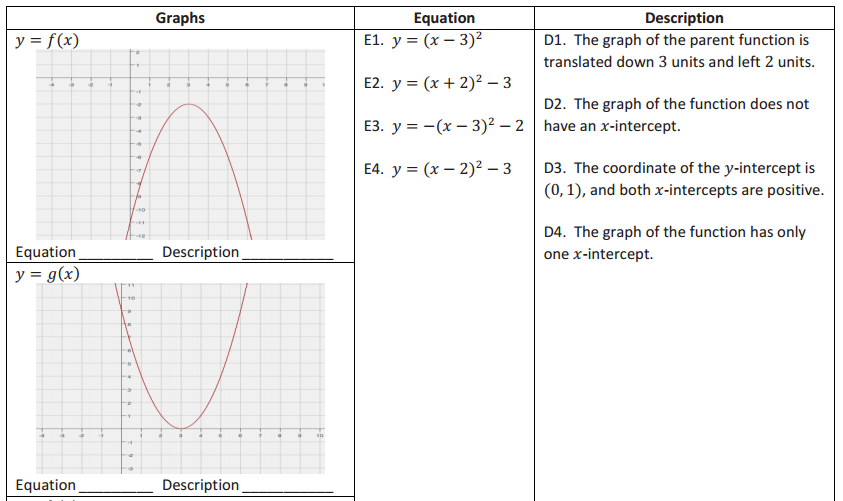
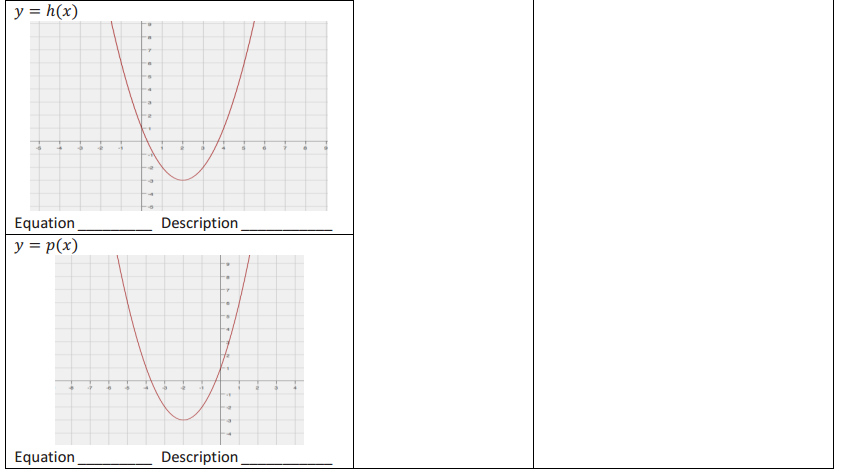
Question 1.
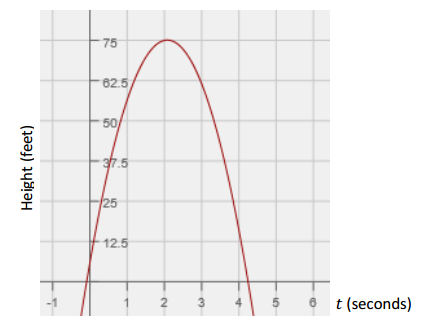
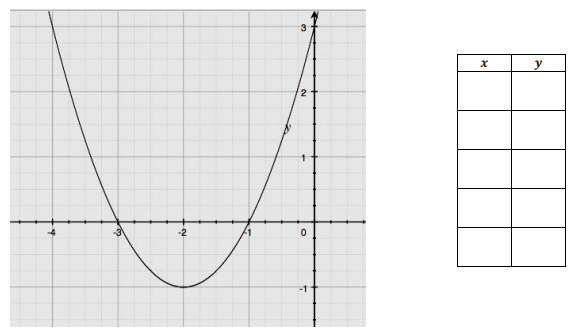
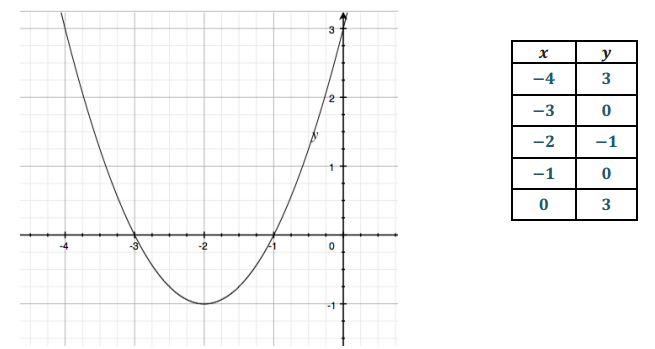
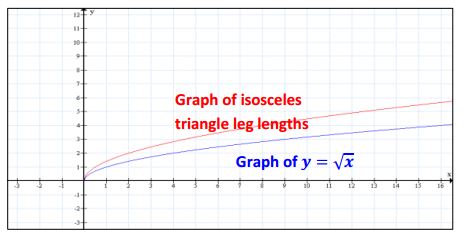
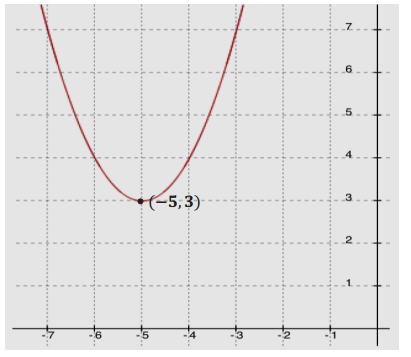
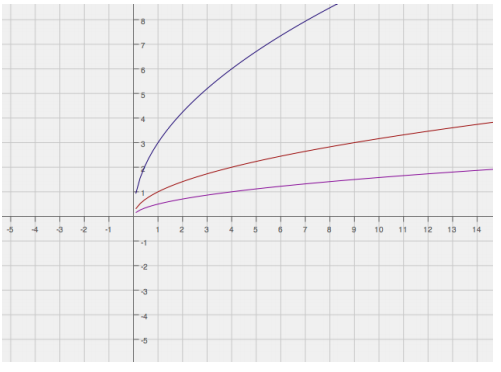
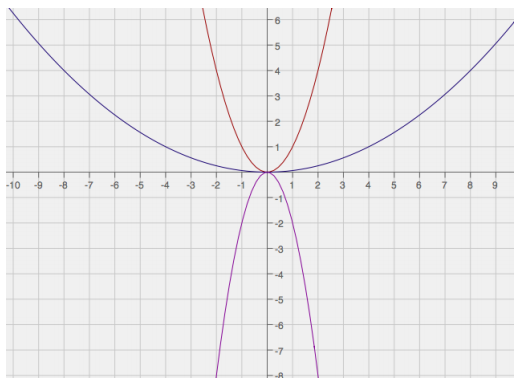
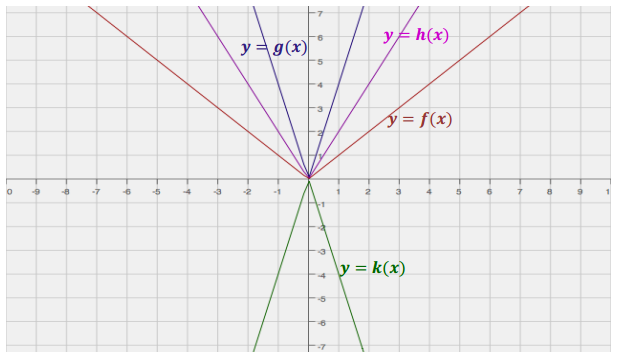
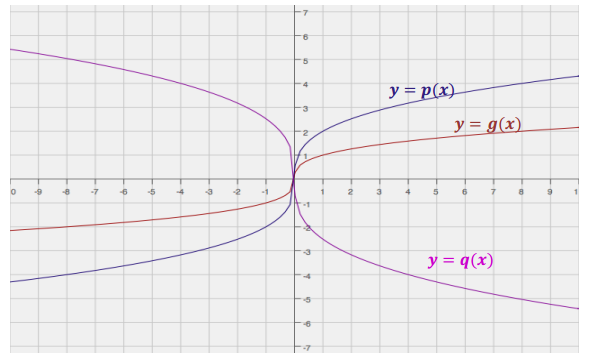
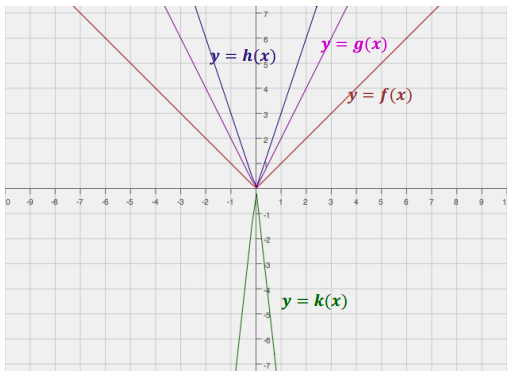
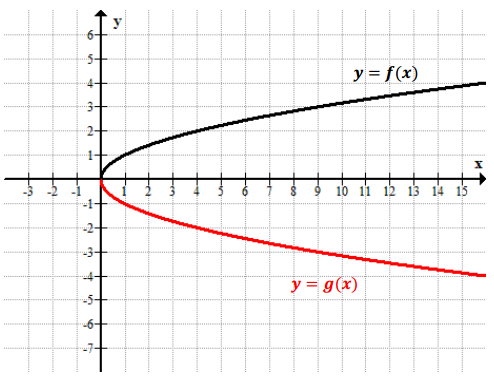
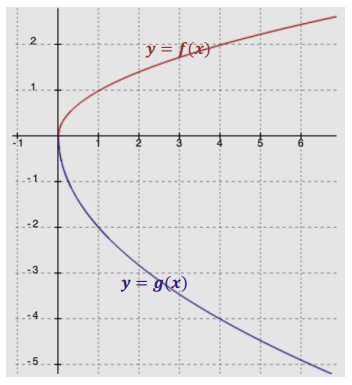
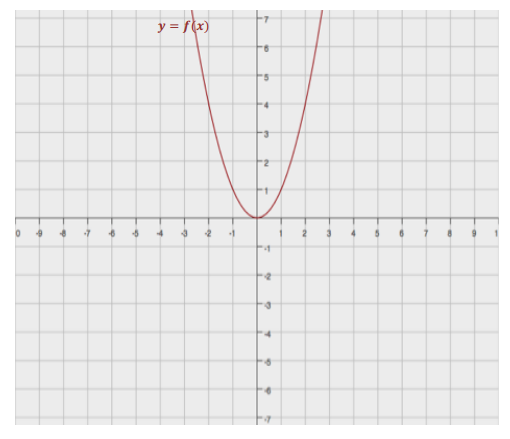
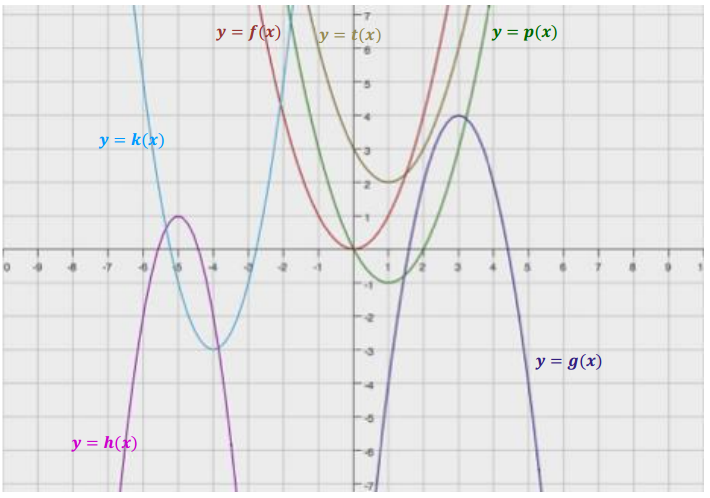
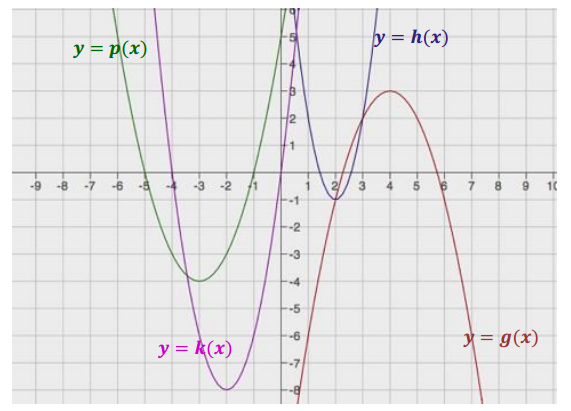
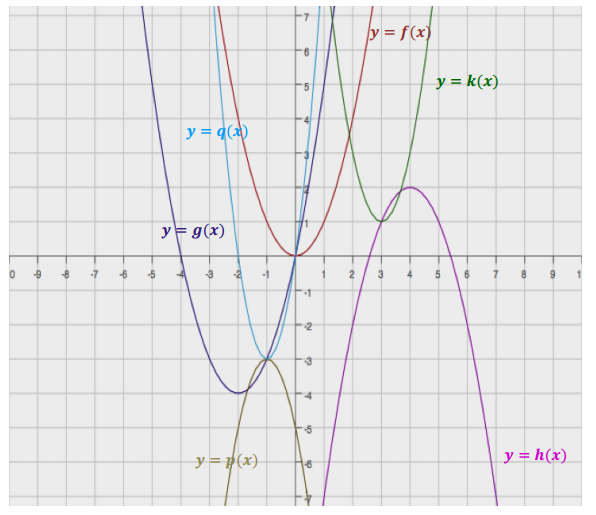
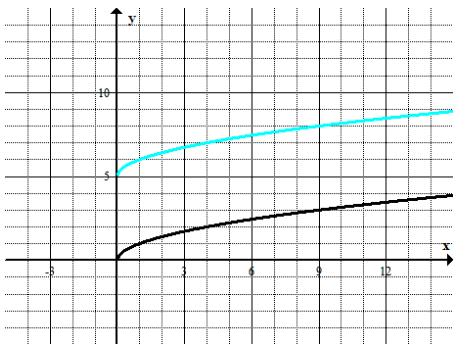
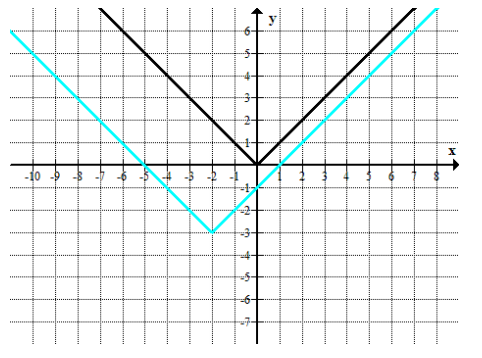
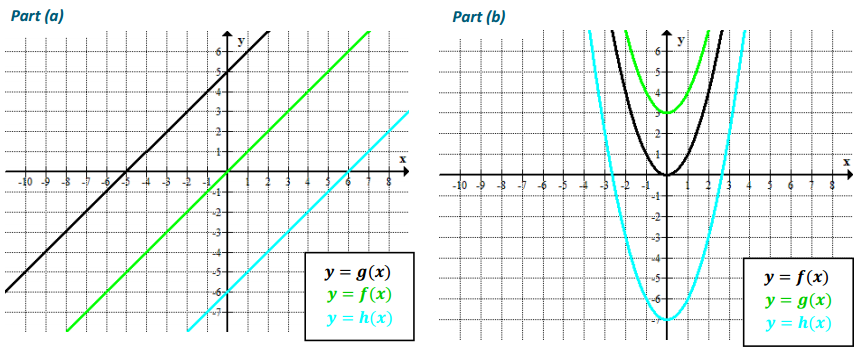
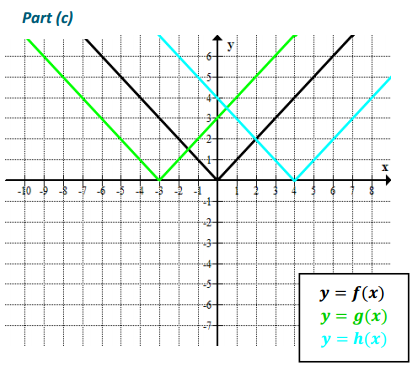
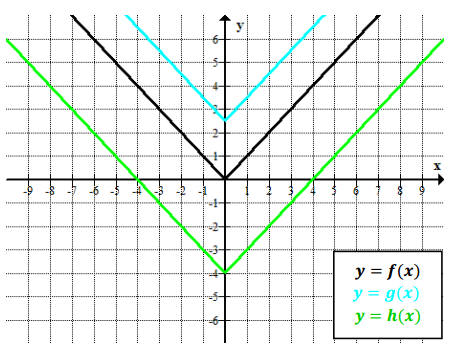
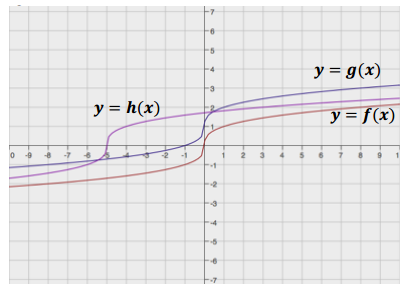
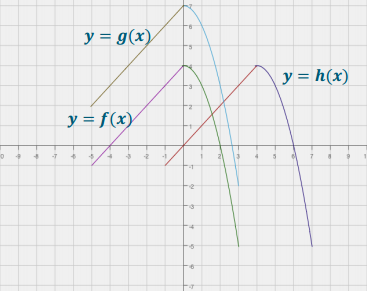
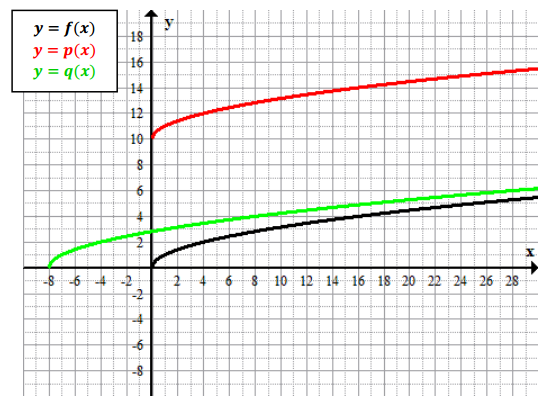
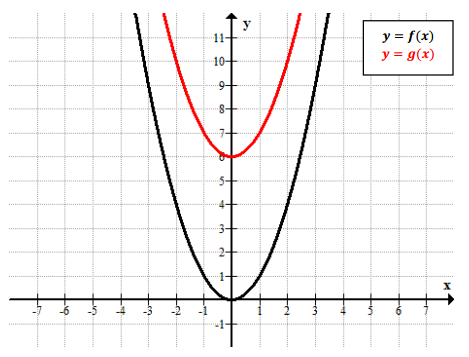
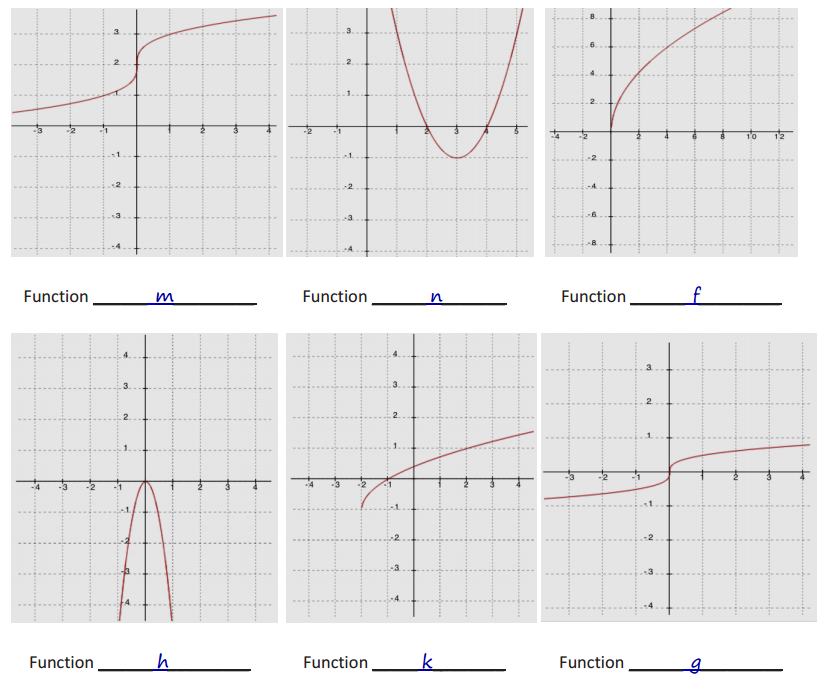
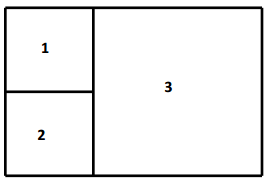
Label each graph with the function it represents; choose from those listed below.
f(x) = 3\(\sqrt{x}\)
g(x) = \(\frac{1}{2}\) \(\sqrt [ 3 ]{ x }\)
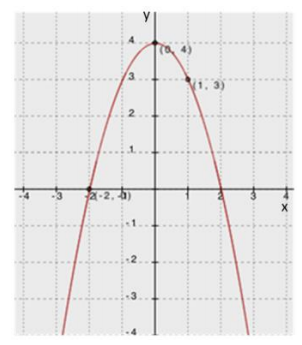
h(x) = -5x2
k(x) = \(\sqrt{x+2}\) – 1
m(x) = \(\sqrt [ 3 ]{ x }\) + 2
n(x) = (x – 3)2-1
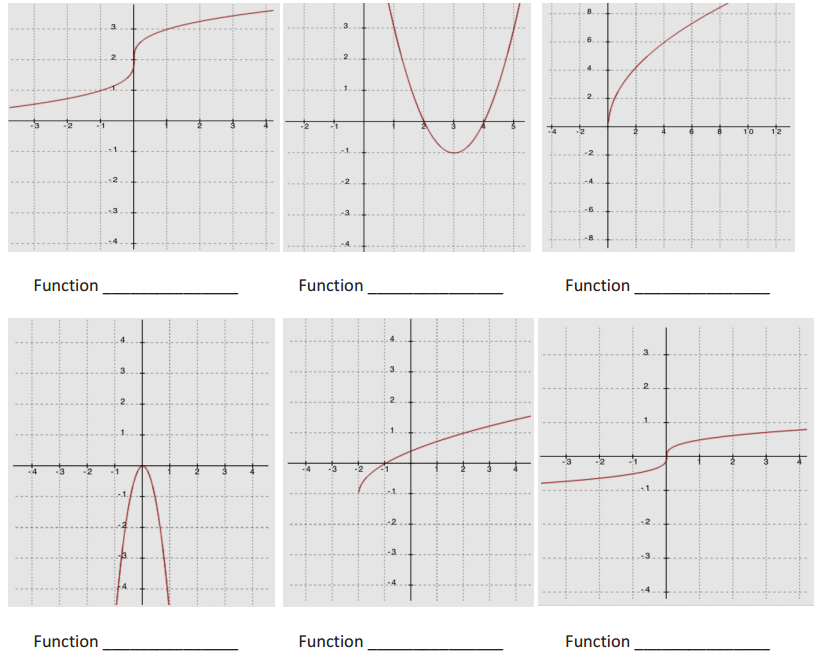
Answer:
Question 2.
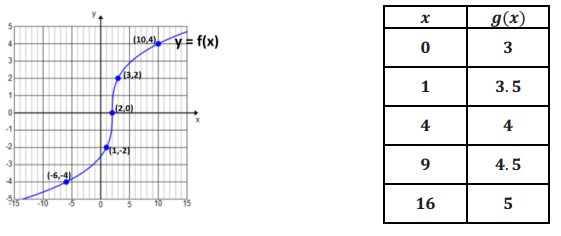
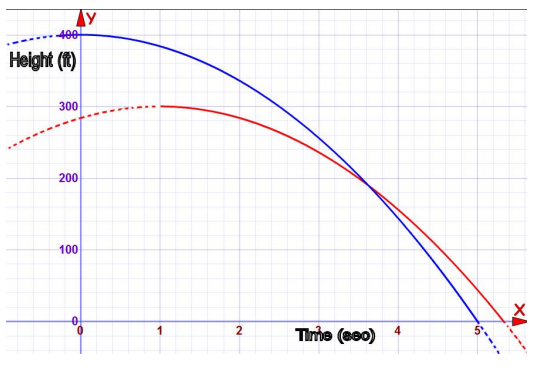
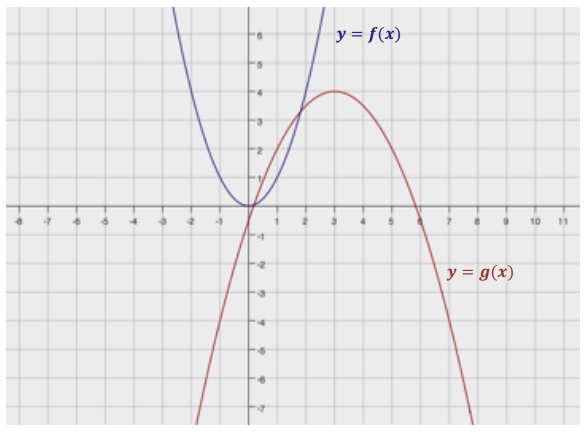
Compare the following three functions.
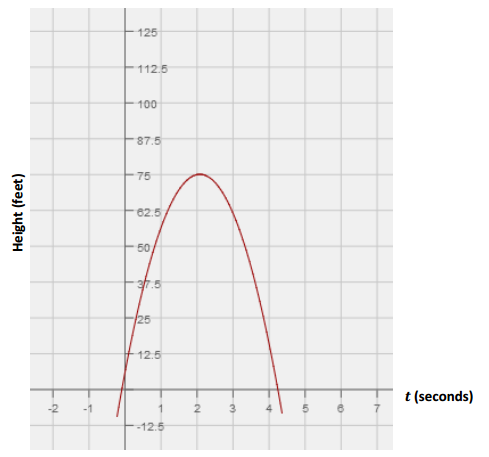
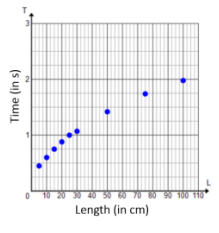
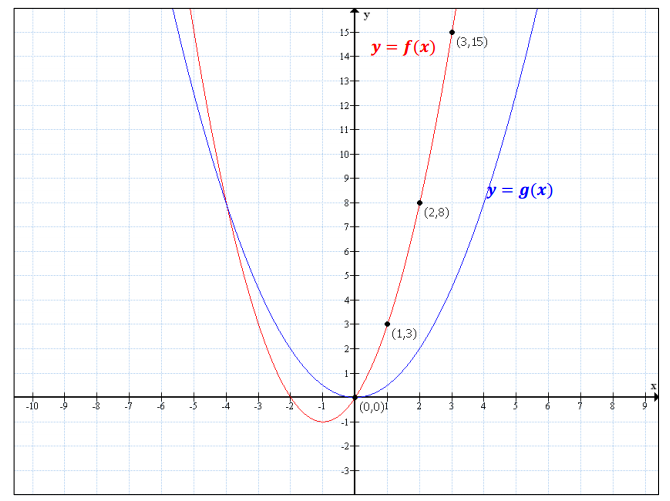
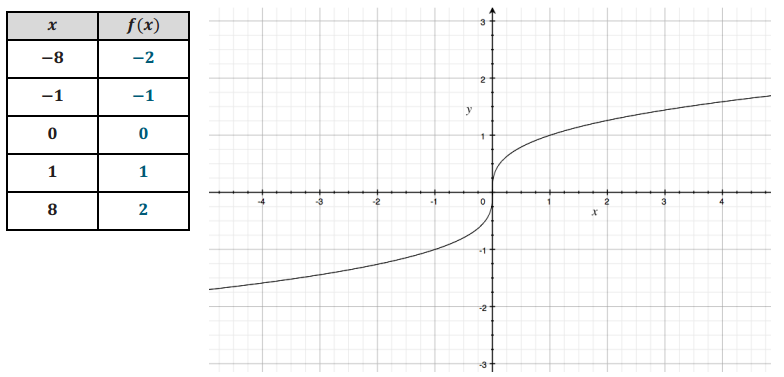
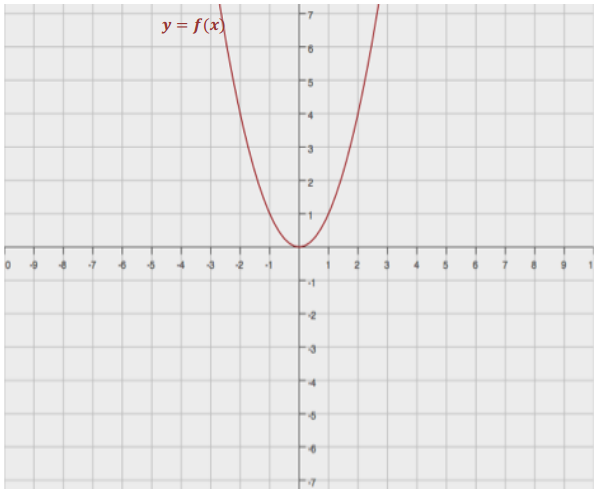
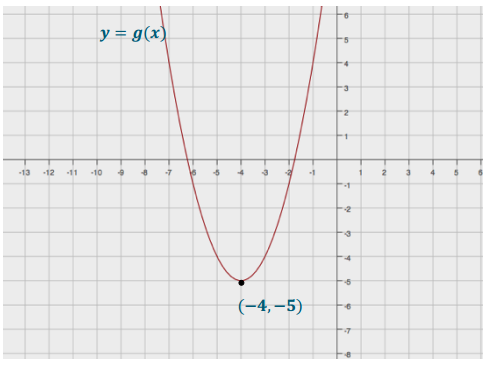
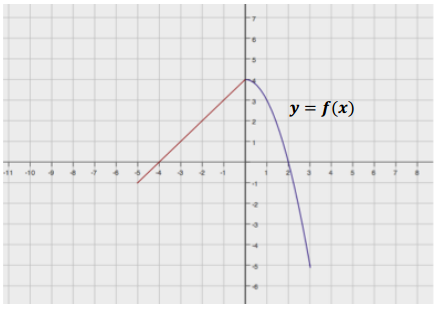
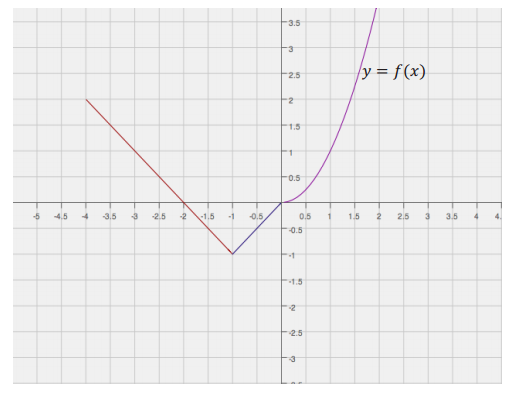
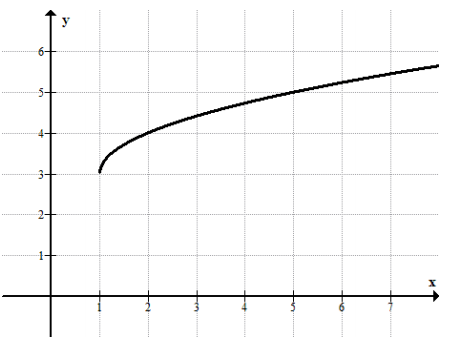
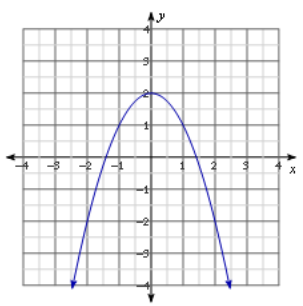
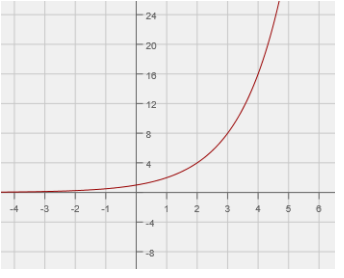
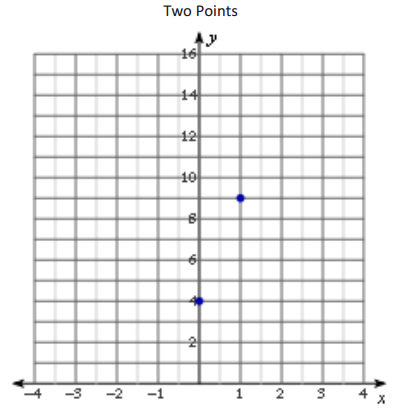
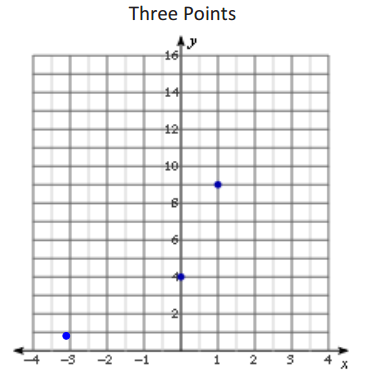
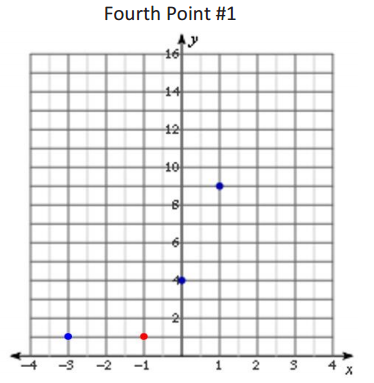
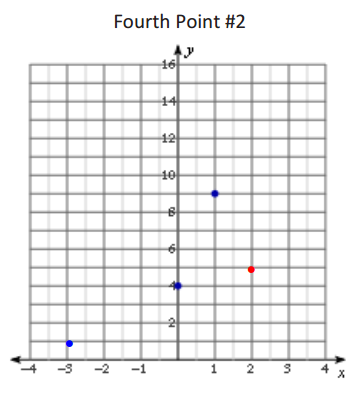
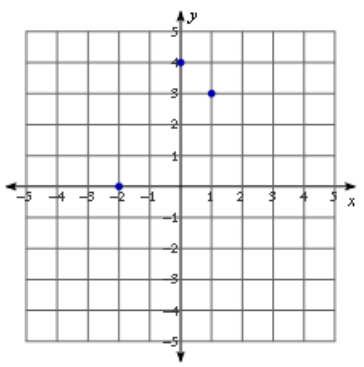
i. A function f is represented by the graph below.
Answer:
Note: f(x) = 2x
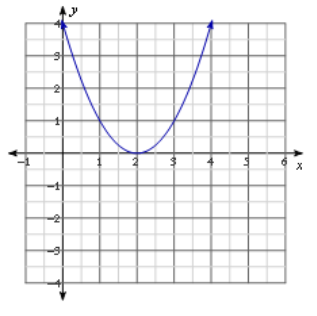
ii. A function g is represented by the following equation.
g(x)=(x – 6)2 – 36
Answer:
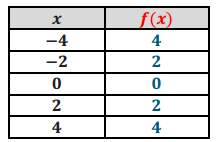
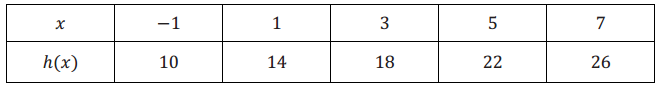
Note: h(x) = 2x +12
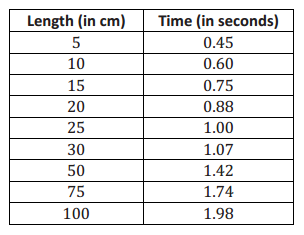
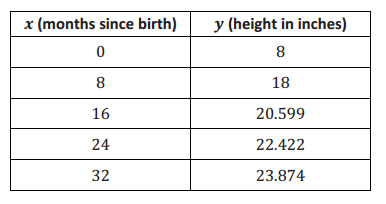
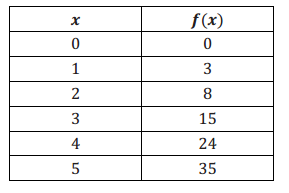
iii. A linear function h is represented by the following table.
For each of the following, evaluate the three expressions given, and identify which expression has the largest value and which has the smallest value. Show your work.
a. f(0), g(0), h(0)
Answer:
f(0) =1, g(0) = 0, h(0) = 12, so
g(0) has the smallest value, and h(0) has the largest value.
b. \(\frac{f(4)-f(2)}{4-2}, \frac{g(4)-g(2)}{4-2}, \frac{h(4)-h(2)}{4-2}\)
Answer:
f(4) = 16 f(2)= 4 : g(4) = –32 g(2) = –20 : h(4) = 20 h(2) = 16
So, the values for the average rate of change over the interval [2, 4] for each function are as follows:
f: 6 g: –6 h: 2
The rate of change of g has the smallest value, -6, meaning it is decreasing relatively quickly; the rate of change of f has the largest value, 6; f is increasing at the same rate that g is decreasing; the rate of change of h is slowest.
c. f(1000), g(1000), h(1000)
Answer:
f(1000) = 21000 = 1.1 × 10301; g(1000) = 9942 – 36 = 988,000; h(1000) = 2012
h(1000) has the smallest value, and f(1000) has the largest value.
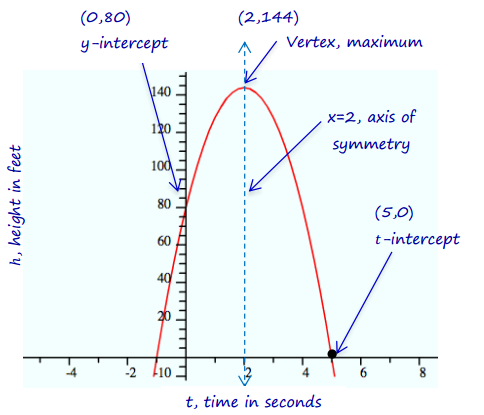
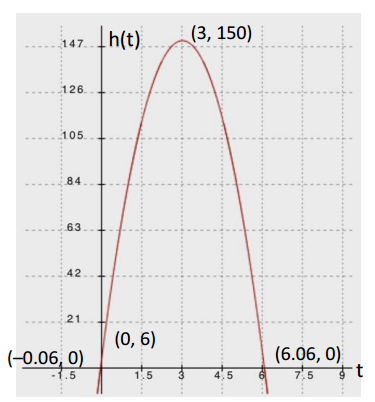
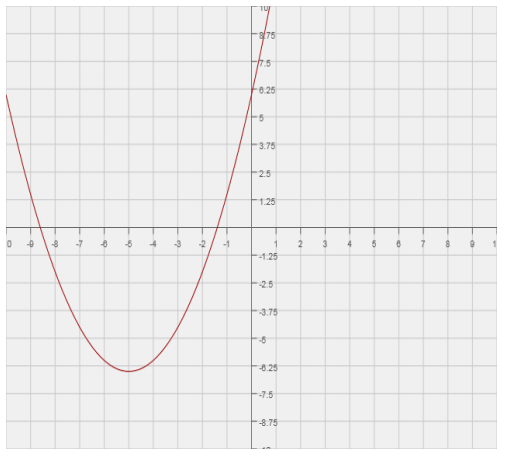
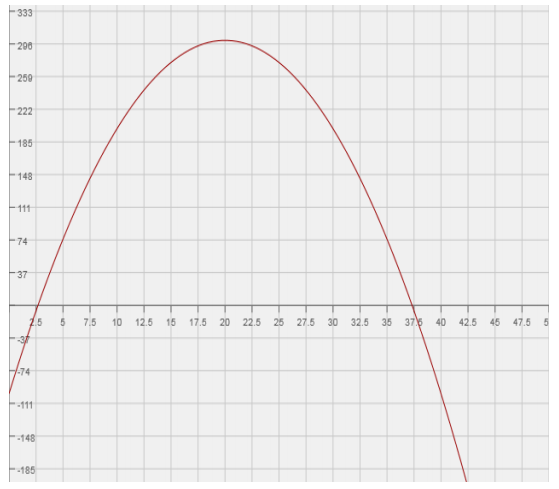
Question 3.
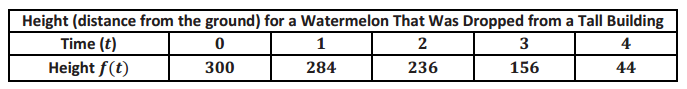
An arrow is shot into the air. A function representing the relationship between the number of seconds it is in the air, t, and the height of the arrow in meters, h, is given by
h(t) = -4.9t2 + 29.4t + 2.5.
a. Complete the square for this function. Show all work.
Answer:
h(t) = -4.9t2 + 29.4t + 2.5 = –4.9(t2 + 6t + ) + 2.5 (factoring out the –4.9 from the two t terms and leaving the constant outside the parentheses)
= –4.9(t2 – 6t + 9) + 2.5 + 44.1 (completing the square inside the parentheses)
= –4.9(t – 3)2 + 46.6
b. What is the maximum height of the arrow? Explain how you know.
Answer:
46.6 m—this is the value of the function at its vertex, so it is the highest the arrow will reach before it begins its descent.
c. How long does it take the arrow to reach its maximum height? Explain how you know.
Answer:
3 sec., because that is the t-value (time in seconds) at which the arrow reached its highest point.
d. What is the average rate of change for the interval from t = 1 to t = 2 seconds? Compare your answer to the average rate of change for the interval from t = 2 to t = 3 seconds, and explain the difference in the context of the problem.
Answer:
h(2) = –4.9(4) + 29.4(2) + 2.5 = 41.7
h(1) = –4.9(1) + 29.4(1) + 2.5 = 27
The average rate of change for the interval [1, 2] is \(\frac{41.7-27}{2-1}\) = 14.7.
h(2) = 41.7
h(3) = –4.9(9) + 29.4(3) + 2.5 = 46.6
The average rate of change for the interval [2, 3] is \(\frac{46.6-41.7}{3-2}\) = 4.9.
The average rate of change for the interval from t = 1 to t = 2 seconds is 14.7 meters per second. The average rate of change for the interval from t = 2 to t = 3 seconds is 4.9 meters per second. Comparing the average rate of change for the intervals [1, 2] and [2, 3] shows that the arrow is moving faster in the first interval than during the second interval. As the arrow moves upward, the rate slows until it finally turns and begins its downward motion.
e. How long does it take the arrow to hit the ground? Show your work, or explain your answer.
Answer:
Since the zeros for the function are at –0.08 and 6.08 seconds, the arrow was in flight from 0–6.08 seconds.
f. What does the constant term in the original equation tell you about the arrow’s flight?
Answer:
The constant (2.5) represents the height when t = 0 or h(0). That is the initial height of the arrow when it was shot, 2.5 m. (Note: 2.5 m is approximately 8 ft. 2 in. Since a bow and arrow at the ready is held a full arm’s length above the head, this would suggest that the person shooting the arrow was around 6 ft. tall.)
g. What do the coefficients on the second- and first-degree terms in the original equation tell you about the arrow’s flight?
Answer:
–4.9: This is half of the local gravitational constant, -9.8 m/s2.
29.4: The initial velocity of the arrow as it was shot upward was 29.4 m/s (approximately 66 mph).
Question 4.
Rewrite each expression below in expanded (standard) form:
a. (x+\(\sqrt{3}\))2
Answer:
x2 + 2\(\sqrt{3}\)x + (\(\sqrt{3}\))2
=x2 + 2\(\sqrt{3}\) x + 3
b. (x-2\(\sqrt{5}\))(x-3\(\sqrt{5}\))
Answer:
x 2 – 3\(\sqrt{5}\) x – 2\(\sqrt{5}\) x + (2 \(\sqrt{5}\))(3\(\sqrt{5}\))
x 2 – 5\(\sqrt{5}\) x + 30
c. Explain why, in these two examples, the coefficients of the linear terms are irrational and the constants are rational.
Answer:
When two irrational numbers are added (unless they are additive inverses), the result is irrational. Therefore, the linear term will be irrational in both of these cases. When a square root is squared or multiplied by itself, the result is rational.
Factor each expression below by treating it as the difference of squares:
d. q2 – 8
Answer:
(q + \(\sqrt{8}\))(q – \(\sqrt{8}\))
(q + 2\(\sqrt{2}\))(q – 2\(\sqrt{2}\))
e. t – 16
Answer:
(\(\sqrt{t}\) + 4)(\(\sqrt{t}\) – 4) or
(-\(\sqrt{t}\) + 4)(-\(\sqrt{t}\) – 4) )
Question 5.
Solve the following equations for r. Show your method and work. If no solution is possible, explain how you know.
a. r2 + 12r + 18 = 7
Answer:
r2 + 12r + 18 = 7
r2 + 12r + 11 = 0
(r + 1)(r + 11) = 0
r = –1 or –11
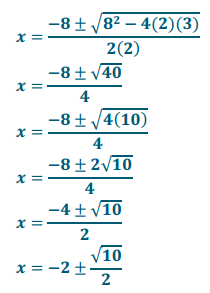
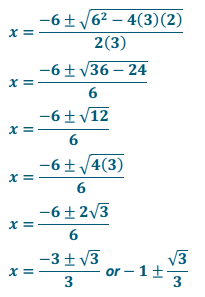
b. r2 + 2r – 3 = 4
Answer:
r2 + 2r – 3 = 4
r2 + 2r – 7 = 0
Completing the square:
r2 + 2r + 1 = 7 + 1
(r + 1)2 = 8
r + 1 = ± 2\(\sqrt{2}\)
r = -1 ± 2\(\sqrt{2}\)
Note: Students may opt to use the quadratic formula to solve this equation.
c. r2 + 18r + 73 = -9
Answer:
r2 + 18r + 73 = –9
r2 + 18r + 82 = 0
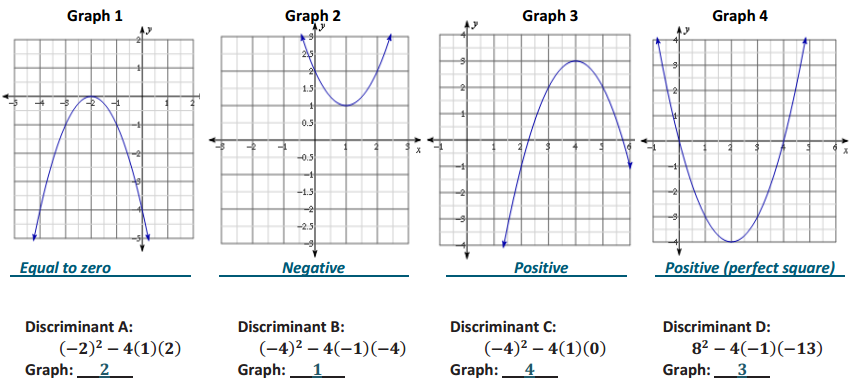
Discriminant:
182 – 4(1)(82) =
324 – 328 =–4
There are no real solutions since the discriminant is negative.
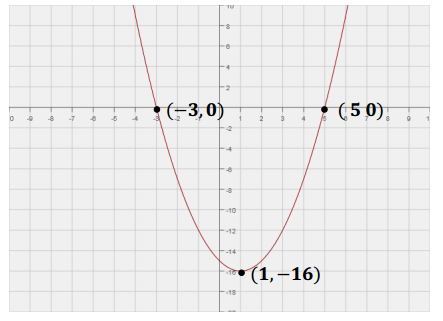
Question 6.
Consider the equation x2 – 2x – 6 = y + 2x + 15 and the function f(x) = 4x2 – 16x – 84 in the following questions:
a. Show that the graph of the equation x2 – 2x – 6 = y + 2x + 15 has x-intercepts at x = -3 and 7.
Answer:
Substituting –3 for x and 0 for y:
9 + 6 – 6 = 0 – 6 + 15
9 = 9
This true statement shows that (–3, 0) is an x-intercept on the graph of this equation.
Substituting 7 for x and 0 for y:
49 – 14 – 6 = 0 + 14 + 15
29 = 29
This true statement shows that (7, 0) is an x-intercept on the graph of this equation.
b. Show that the zeros of the function f(x)=4x2 – 16x – 84 are the same as the x-values of the x-intercepts for the graph of the equation in part (a) (i.e., x = -3 and 7).
Answer:
Substituting x = –3 and f(x) = 0:
4(9) – 16(–3) – 84 = 0
36 + 48 – 84 = 0
0 = 0
Substituting x = 7 and f(x)=0:
4(49) – 16(7) – 84 = 0
196 – 112 – 84 = 0
0 = 0
c. Explain how this function is different from the equation in part (a).
Answer:
The graph of the function would be a vertical stretch, with a scale factor of 4, of the graph of the equation. Or, you could say that the graph of the equation is a vertical shrink, with a scale factor of \(\frac{1}{4}\) of the graph of f. You know this because the formula for the function f is related to the equation. Solving the equation for y, you get y = x2 – 4x – 21. So, y = \(\frac{1}{4}\) f(x).
d. Identify the vertex of the graphs of each by rewriting the equation and function in the completed-square form, a(x – h)2 + k. Show your work. What is the same about the two vertices? How are they different? Explain why there is a difference.
Answer:
x2 – 2x – 6 = y + 2x + 15
y = x2 – 4x – 21
y=(x2 – 4x + 4 ) – 21 – 4
y = (x – 2)2 – 25
Vertex (2, –25)
4x2 – 16x – 84 = f(x)
f(x) = 4(x2 – 4x + 4 ) – 84 – 16
f(x) = 4(x – 2)2 – 100
Vertex (2, –100)
The two vertices have the same x-coordinate (the same axis of symmetry), but the y-coordinate for the vertex of the graph of the function is 4 times the y-coordinate of the vertex of the graph of the two-variable equation because the graph of the function would be a vertical stretch (with a scale factor of 4) of the graph of the equation.
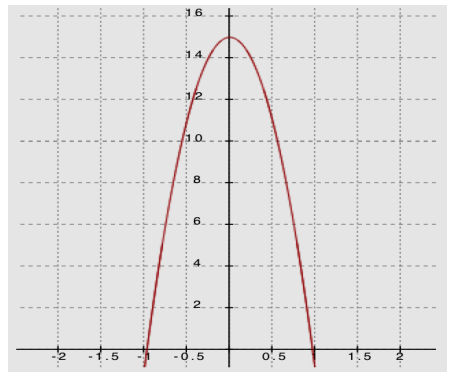
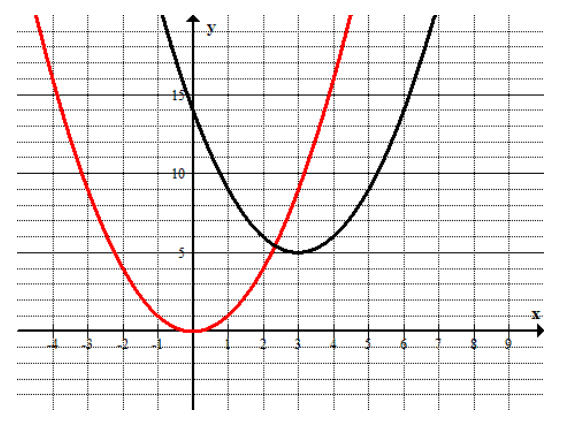
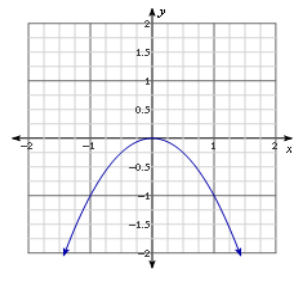
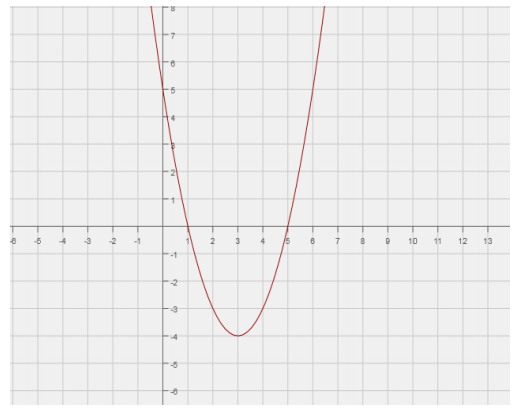
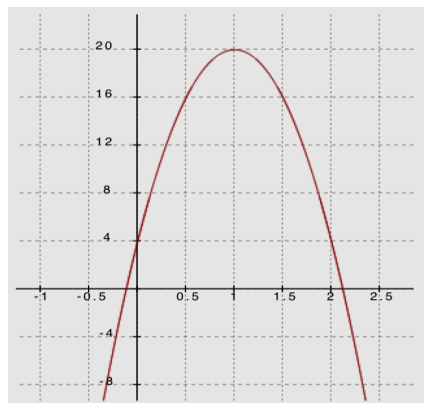
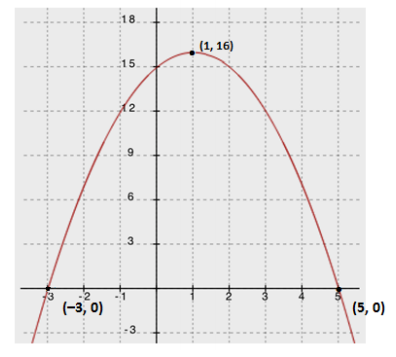
e. Write a new quadratic function with the same zeros but with a maximum rather than a minimum. Sketch a graph of your function, indicating the scale on the axes and the key features of the graph.

Answer:
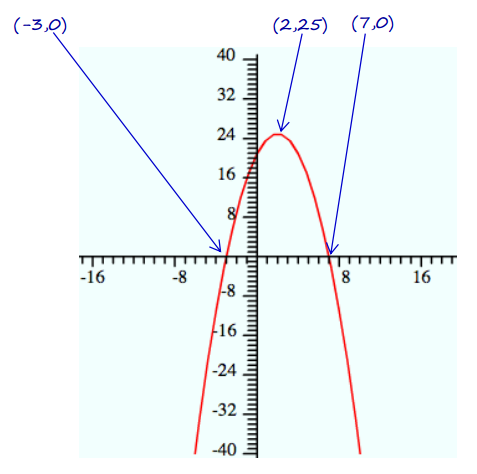
Notes: Factored form is easiest to use with the zeros as the given information. We just need to have a negative leading coefficient. Any negative number will work. This example uses a = –1:
f(x) = – (x + 3)(x – 7).
To graph this function, plot the zeros/intercepts (–3, 0) and (7, 0). The vertex will be on the axis of symmetry (x = 2). Evaluate the equation for x = 2 to find the vertex, (2, 25), and sketch.
Results for the graphs may be wider or narrower, and the vertex may be higher or lower. However, all should open down, pass through the points (–3, 0) and (7, 0), and have 2 as the x-coordinate for the vertex.


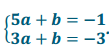
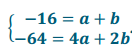
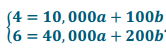
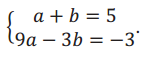 . Use substitution or elimination to determine that a = 1 and b = 4.
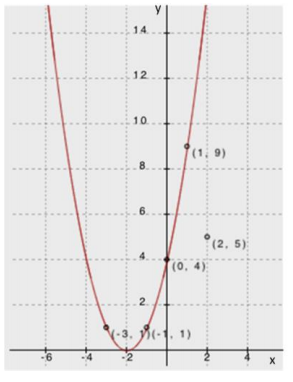
 .
.
 .
.
 .
.