Engage NY Eureka Math Precalculus Module 5 Lesson 12 Answer Key
Eureka Math Precalculus Module 5 Lesson 12 Exploratory Challenge/Exercise Answer Key
Exploratory Challenge 1/Exercises 1–2: Moving Along
In a certain game, you toss 2 dice and find the difference of the numbers showing on the faces. You move along a number line according to the absolute value of the difference. For example, if you toss a 6 and a 3 on the first toss, then you move 3 spaces from your current position on the number line. You begin on the number 0, and the game ends when you move past 20 on the number line.
Exercise 1.
How many rolls would you expect it to take for you to get to 20? Explain how you would use simulation to answer this question.
Answer:
Answers will vary. It appears that many rolls result in a difference of 1, 2, or 3. Considering that I need to move 20 spaces, I would say that I expect that it would take around 8, 9, or 10 rolls to get to 20.
The random variable of interest is the distance moved on the number line for a toss of the dice. The possible values are 0, 1, 2, 3, 4, and 5. I would play the game with my partner at least 30 times and record the distance moved for each toss. Then, I would use the results to create an estimated probability distribution to determine expected value for the distance moved on 1 toss of the dice.
Exercise 2.
Perform the simulation with your partner.
a. What is the expected value for the distance moved on 1 toss of 2 dice? Interpret your answer in terms of playing the game.
Answer:
Responses will vary. One possible response based on 60 tosses is shown here:
Distance moved on 1 toss of 2 dice
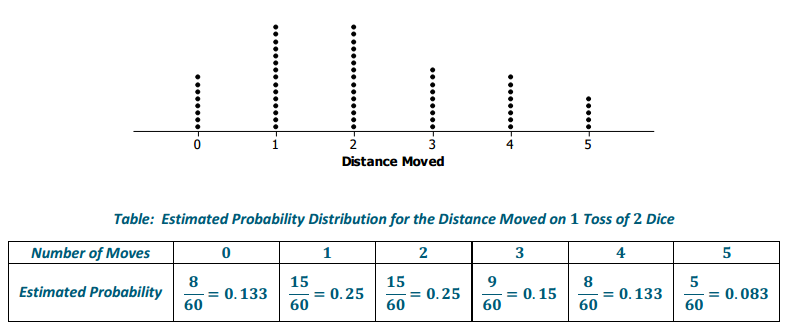
The example results are as follows:
0(0.133) + 1(0.25) + 2(0.25) + 3(0.15) + 4(0.133) + 5(0.083) = 2.147.
In the long run, after tossing 2 dice many times, we expect the average distance moved to be close to 2.15.
b. Use your expected value from part (a) to find the expected number of tosses that would put you past 20 on the number line.
Answer:
Responses will vary.
For the sample data, in 10 tosses, you would expect to be at about 21 or 22.
Exploratory Challenge 2/ Exercises 3–4: Lemon Flavor
Cough drops come in a roll with 2 different flavors, lemon and cherry. The same number of lemon and cherry cough drops are produced. Assume the cough drops are randomly packed with 30 per roll and that the flavor of a cough drop in the roll is independent of the flavor of the others.
Exercise 3.
Suppose you really liked the lemon flavor. How many cough drops would you expect to go through before finding 2 lemon cough drops in a row? Explain how you would use simulation to answer this question.
Answer:
Responses will vary. Students might answer anywhere from 3 to 20.
To simulate, I would generate random numbers from the set {0,1}, with 1 representing lemon. The random variable is the number of cough drops before you have 2 lemon cough drops in a row. The possible values are 2, 3, 4, 5, 6, 7, 8, 9, 10, 11, 12, on up to 30. In a case where 2 lemon cough drops do not occur in the pack of 30, I would use 0 to represent the outcome.
I would simulate the experiment at least 50 times and record the number of cough drops I would go through before getting 2 lemon-flavored ones in a row. I would use the results to create a probability distribution that could be used to estimate the number of cough drops I expect to go through before finding 2 lemon-flavored ones in a row.
Exercise 4.
Carry out the simulation, and use your data to estimate the average number of cough drops you would expect to go through before you found 2 lemon-flavored ones in a row. Explain what your answer indicates about 2 lemon-flavored cough drops in a row.
Answer:
Responses will vary. Sample results are below. Students might be surprised that in one case, it took 24 cough drops before they had 2 lemon-flavored ones in a row.
Number before 2 in a row/frequency:
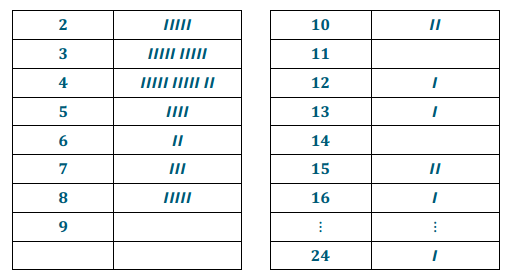
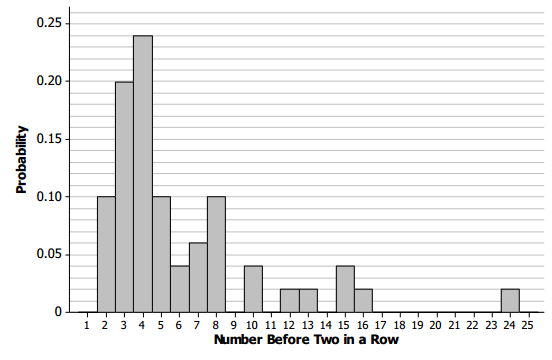
Using the sample data above, the expected value would be 6.02. If you opened many packages of cough drops, on average you would go through about 6 cough drops before you got 2 lemon-flavored ones in a row.
Eureka Math Precalculus Module 5 Lesson 12 Problem Set Answer Key
Question 1.
Suppose the rules of the game in Exploratory Challenge 1 changed.
If you had an absolute difference of
3 or more, you move forward a distance of 1;
1 or 2, you move forward a distance of 2;
0, you do not move forward.
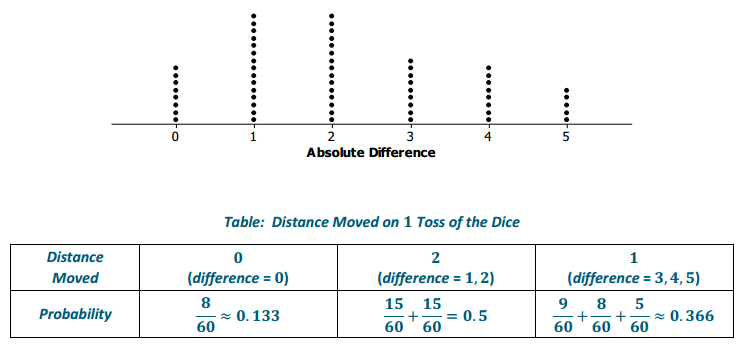
a. Use your results from Exploratory Challenge 1/Exercise 2 to estimate the probabilities for the distance moved on 1 toss of 2 dice in the new game.
Answer:
Responses will vary. Sample answer:
b. Which distance moved is most likely?
Answer:
Responses will vary. Sample response:
For the sample data, a distance of 2 is the most likely with a probability of 0.5.
c. Find the expected value for the distance moved if you tossed 2 dice 10 times.
Answer:
Responses will vary. Sample response:
For the sample data, the expected distance moved in 1 toss is calculated by 0(0.133) + 2(0.5) + 1(0.366) = 1.366, so the expected distance moved in 10 tosses is 13.66.
d. If you tossed the dice 20 times, where would you expect to be on the number line, on average?
Answer:
Responses will vary. Sample response:
For the sample data, over the long run, you would expect to be at about 27 on the number line.
Question 2.
Suppose you were playing the game of Monopoly, and you got the Go to Jail card. You cannot get out of jail until you toss a double (the same number on both dice when 2 dice are tossed) or pay a fine.
a. If the random variable is the number of tosses you make before you get a double, what are possible values for the random variable?
Answer:
1, 2, 3 ,4, 5, 6, 7, 8, 9, 10, 11, 12, …
b. Create an estimated probability distribution for how many times you would have to toss a pair of dice to get out of jail by tossing a double. (You may toss actual dice or use technology to simulate tossing dice.)
Answer:
Responses will vary.
For the sample data below, an estimated probability distribution would be as follows:
Table: Number of Times Tossing a Pair of Dice Before a Double Occurs

The table below displays the simulated tosses. The table is read down each column, from left to right. The first number represents the difference in the faces of simulated tosses of 2 dice, and the number 0 represents a double was tossed. All doubles have been highlighted. The number of times the dice were tossed between doubles appears in parentheses.
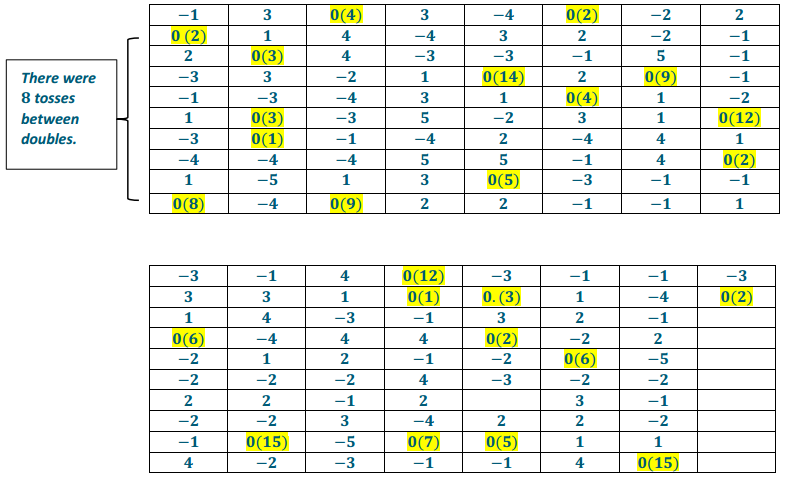
Summary of number of tosses of dice from simulation:

c. What is the expected number of tosses of the dice before you would get out of jail with a double?
Answer:
Responses will vary.
For the sample data, the expected number is 4.16. Over the long run, you would expect to toss the dice about 4 times before you got a double.
Question 3.
The shuttle company described in the Exit Ticket found that when they make 11 reservations, the average number of people denied a seat per shuttle is about 1 passenger per trip, which leads to unhappy customers. The manager suggests they take reservations for only 10 seats. But his boss says that might leave too many empty seats.
a. Simulate 50 trips with 10 reservations, given that in the long run, 10% of those who make reservations do not show up. (You might let the number 1 represent someone who does not show up, or a no-show, and a 0 represent someone who does show up. Generate 10 random numbers from the set that contains one 1 and nine 0s to represent the 10 reservations, and then count the number of 1s.)
Answer:
Responses will vary. Sample response:
Table: Simulated Results of the Number of No-Shows Given That 10% Are No-Shows

b. If 3 people do not show up for their reservations, how many seats are empty? Explain your reasoning.
Answer:
2 seats are empty because there are only 9 seats on the shuttle.
c. Use the number of empty seats as your random variable, and create an estimated probability distribution for the number of empty seats.
Answer:
Responses will vary.
Note that there are no empty seats when 9 or 10 people with reservations show up because there are only 9 seats on the shuttle.
Table: Number of Empty Seats on Shuttle

d. What is the expected value for the estimated probability distribution? Interpret your answer from the perspective of the shuttle company.
Answer:
Responses will vary.
For the sample data, the expected value is 0.38, which means that over the long run, 0.38 seats are empty per shuttle.
e. How many reservations do you think the shuttle company should accept and why?
Answer:
Responses will vary.
In the long run, about 1 person per trip would be denied a seat if they make 11 reservations, and they will have an empty seat over 1/3 of the time if they make only 10 reservations. What they choose to do would depend on how much they have to compensate those who are denied seats.
Eureka Math Precalculus Module 5 Lesson 12 Exit Ticket Answer Key
Question 1.
A bus company has 9 seats on a shuttle between two cities, but about 10% of the time people do not show up for the bus even though they reserve a seat. The company compensates by reserving 11 seats instead of 9. Assume that whether or not a person with a reservation shows up is independent of what happens with the other reservation holders.
a. Consider the random variable number of people who are denied a seat because more than 9 people showed up for the shuttle. What are the possible values of this random variable?
Answer:
0, 1, and 2
b. The table displays the number of people who reserved tickets and did show up based on simulating 50 trips between the two cities. Use the information to estimate a probability distribution of the number of people denied a seat on the shuttle.
Table: Number of People Who Showed Up for Their Reservations

Answer:
Table: Number of People Denied a Seat on Shuttle

c. In the long run, how many people should the company expect to be denied a seat per shuttle trip? Explain how you determined the answer.
Answer:
The company should expect about 0.92 passengers will be denied a seat over the long run, or just less than 1 per trip. I used the sample data to determine the expected value: 0∙0.36 + 1∙0.36 + 2∙0.28 = 0.92.