Engage NY Eureka Math 2nd Grade Module 7 Lesson 2 Answer Key
Eureka Math Grade 2 Module 7 Lesson 2 Problem Set Answer Key
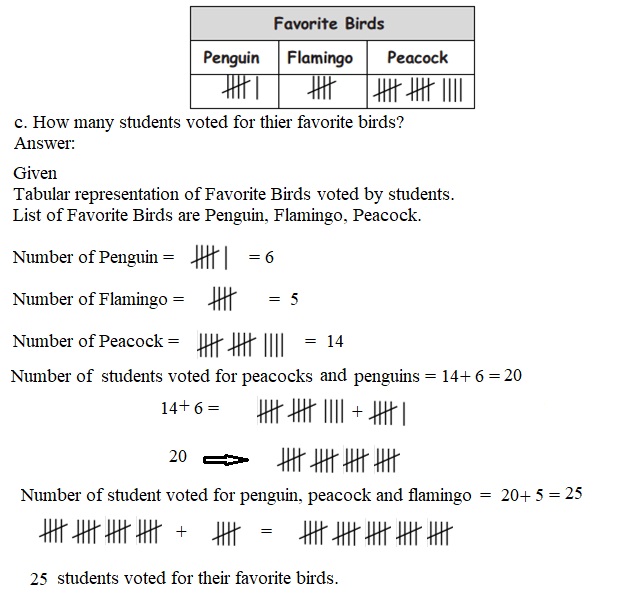
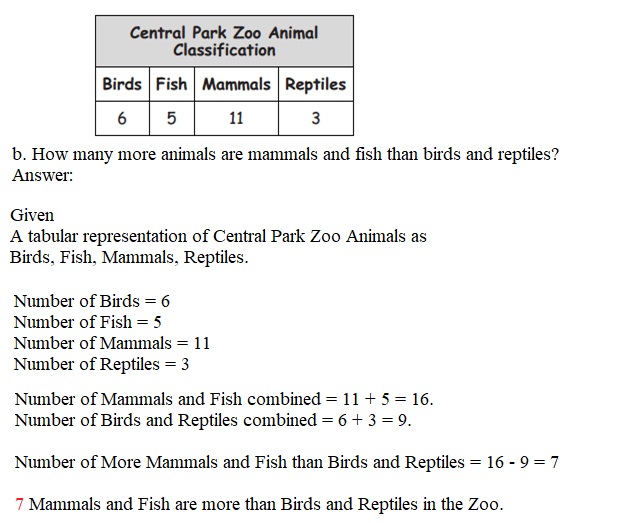
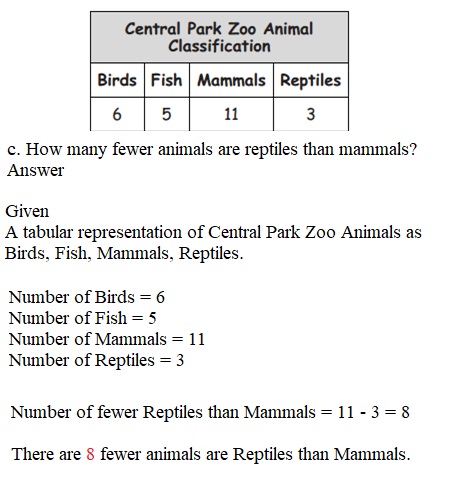
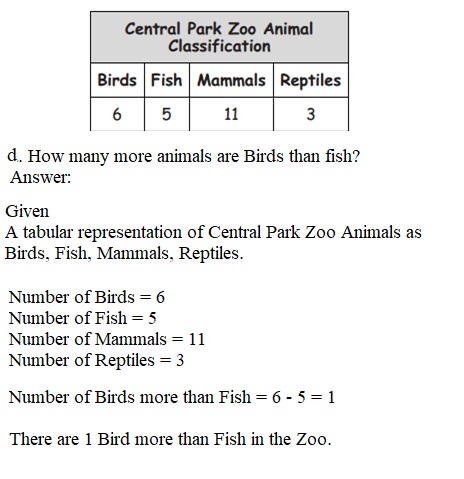
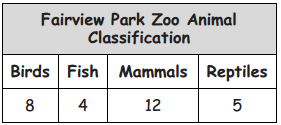
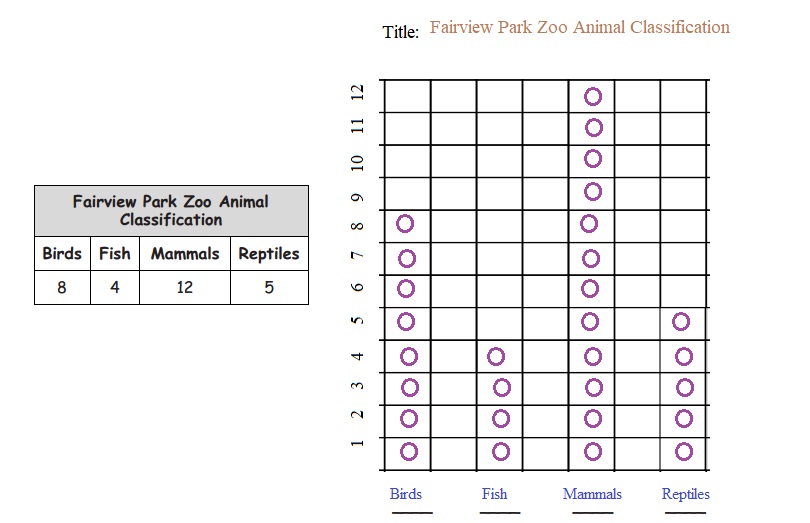
Question 1.
Use grid paper to create a picture graph below using data provided in the table. Then, answer the questions.
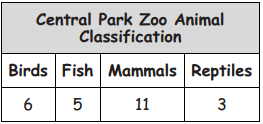
Title: _______

Legend: ______
Answer:
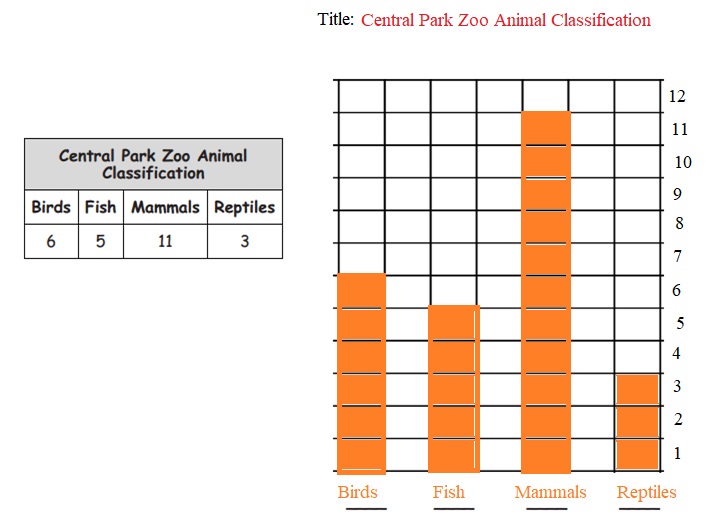
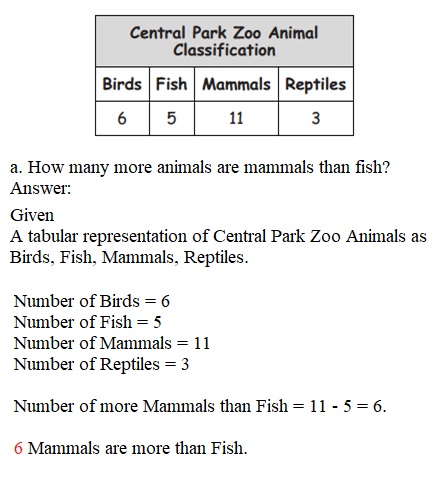
a. How many more animals are mammals than fish?
Answer:
b. How many more animals are mammals and fish than birds and reptiles?
Answer:
c. How many fewer animals are reptiles than mammals?
Answer:
d. Write and answer your own comparison question based on the data.
Question: _________
Answer: __________
Answer:
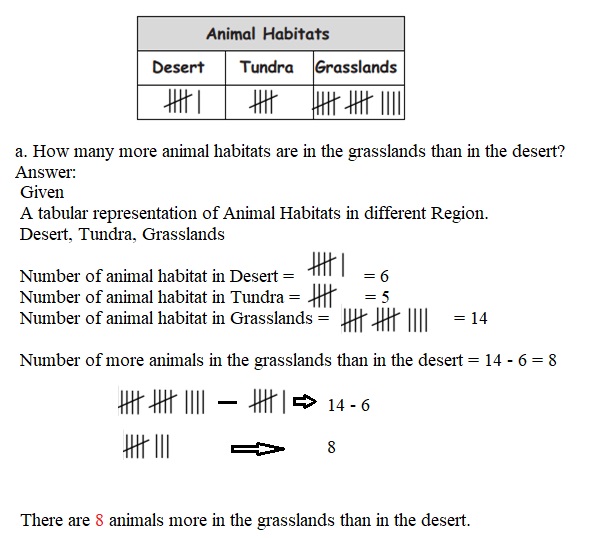
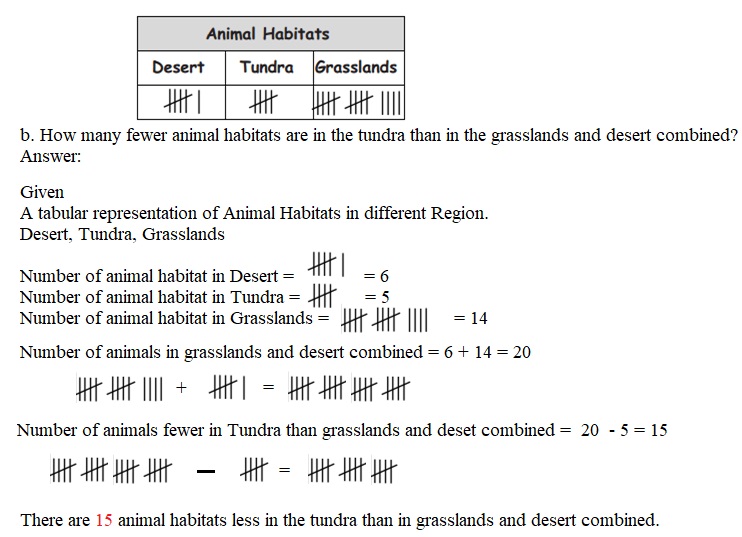
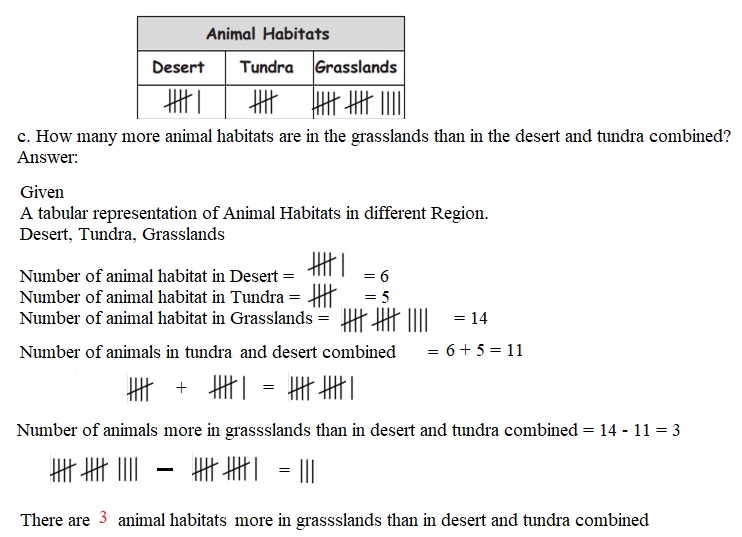
Question 2.
Use the table below to create a picture graph in the space provided.
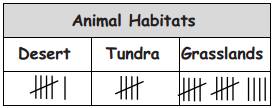
Title: _______

Legend: ______
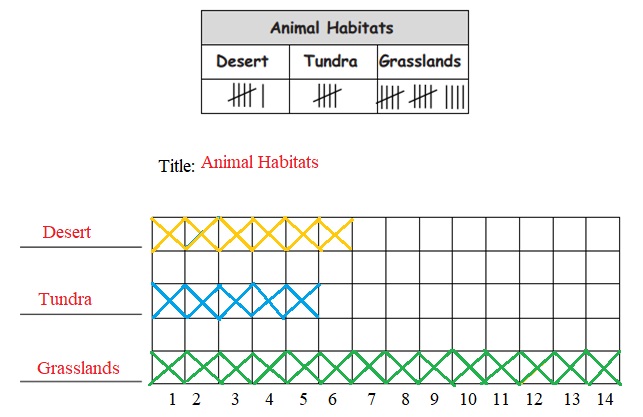
a. How many more animal habitats are in the grasslands than in the desert?
Answer:
b. How many fewer animal habitats are in the tundra than in the grasslands and desert combined?
Answer:
c. Write and answer your own comparison question based on the data.
Question: ______
Answer: _______
Answer:
Eureka Math Grade 2 Module 7 Lesson 2 Exit Ticket Answer Key
Question :
Use grid paper to create a picture graph below using data provided in the table. Then, answer the questions.
Title: ________

Legend: _______
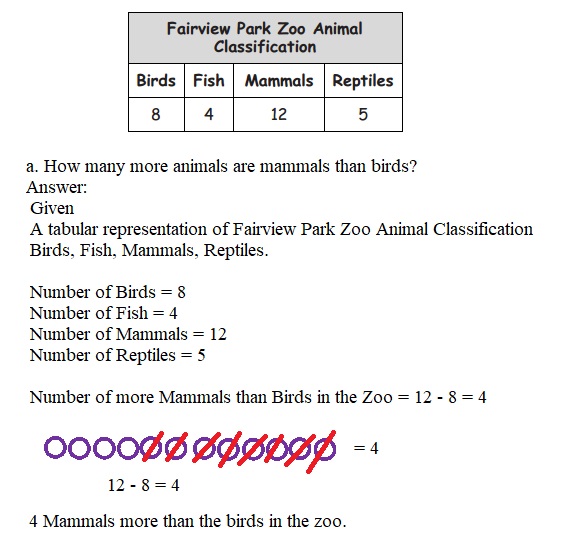
a. How many more animals are mammals than birds?
Answer:
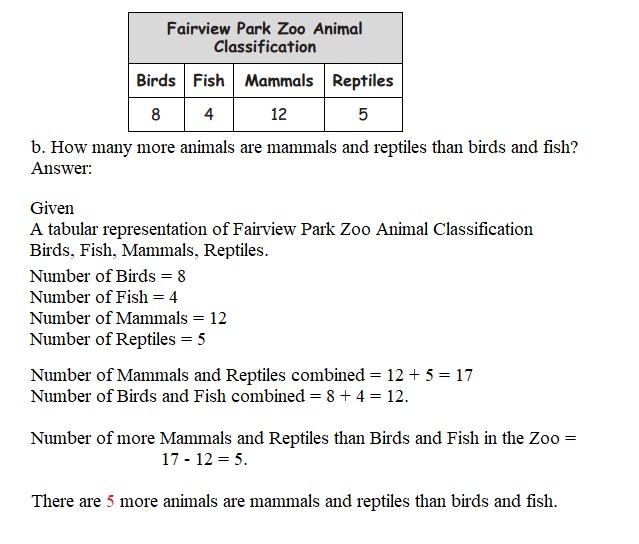
b. How many more animals are mammals and reptiles than birds and fish?
Answer:
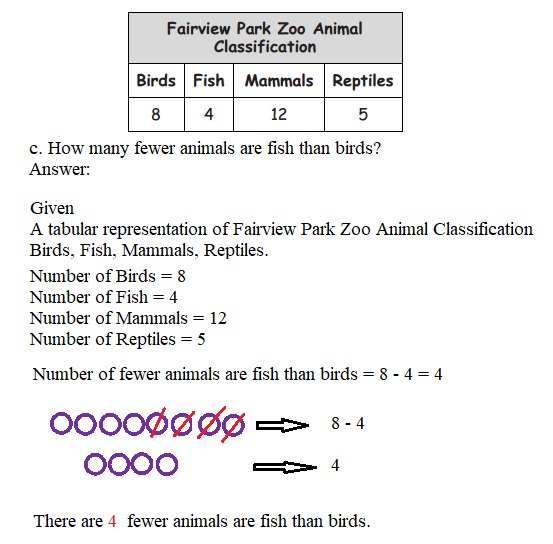
c. How many fewer animals are fish than birds?
Answer:
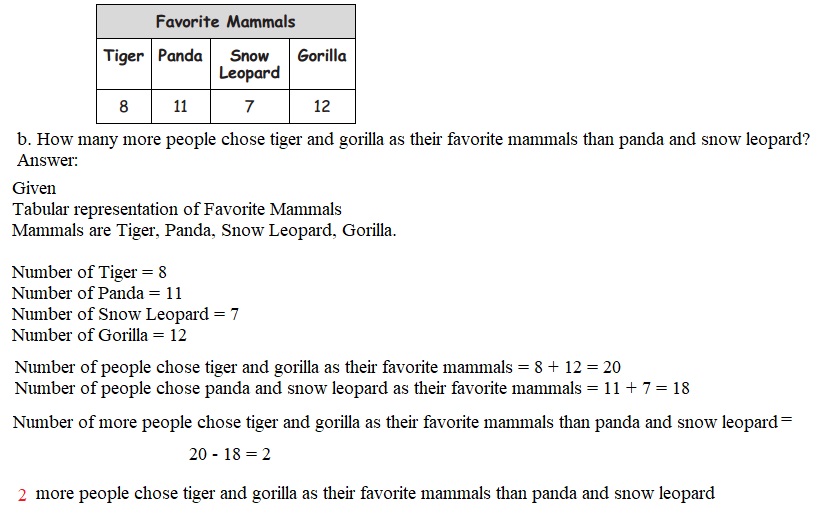
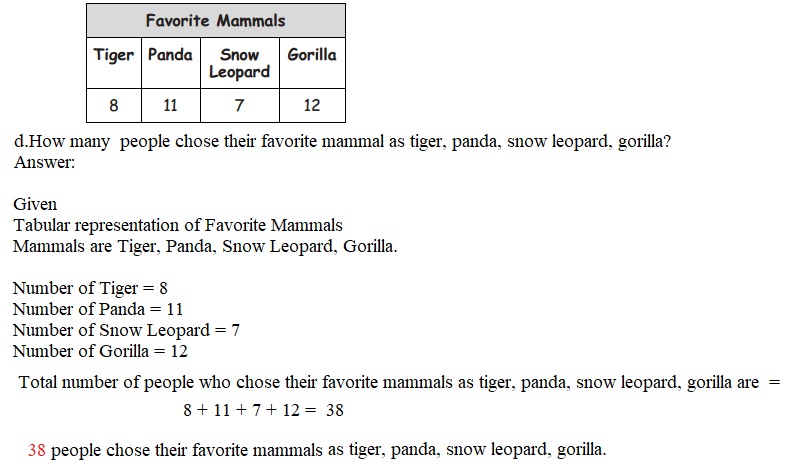
Eureka Math Grade 2 Module 7 Lesson 2 Homework Answer Key
Question 1.
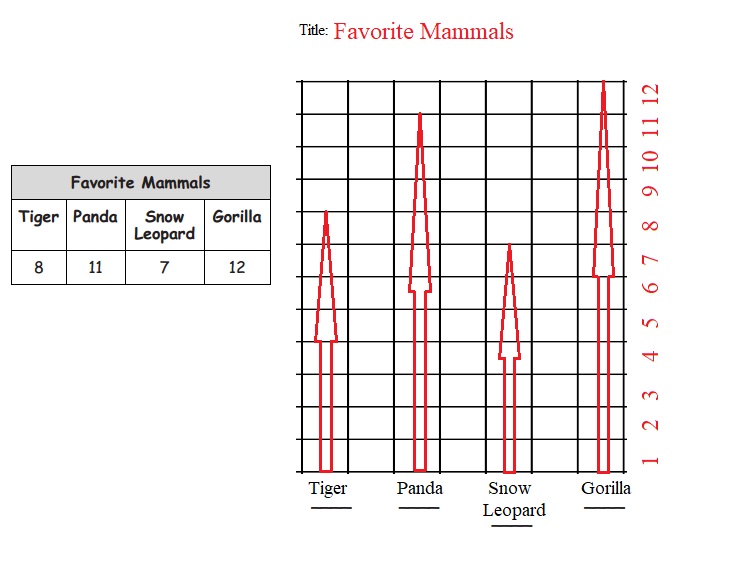
Use grid paper to create a picture graph below using data provided in the table. Then, answer the questions.
Title: ______

Legend: _______
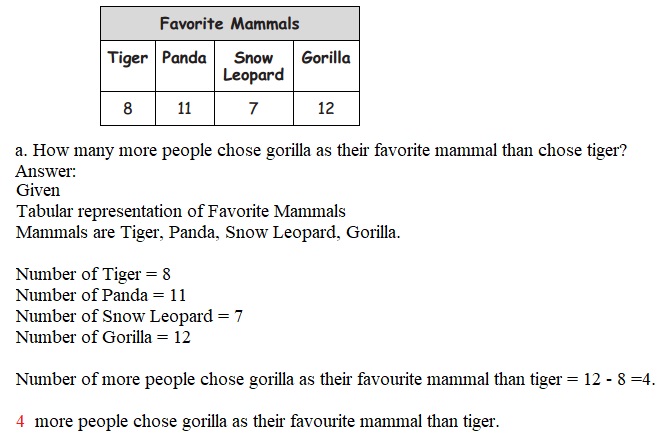
a. How many more people chose gorilla as their favorite mammal than chose tiger?
Answer:
b. How many more people chose tiger and gorilla as their favorite mammals than panda and snow leopard?
Answer:
c. How many fewer people chose tiger as their favorite mammal than panda?
Answer:
d. Write and answer your own comparison question based on the data.
Question: ____
Answer: ____
Answer:
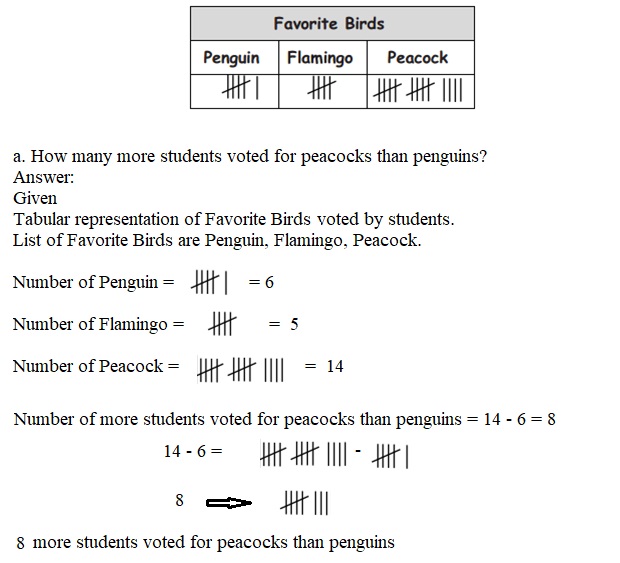
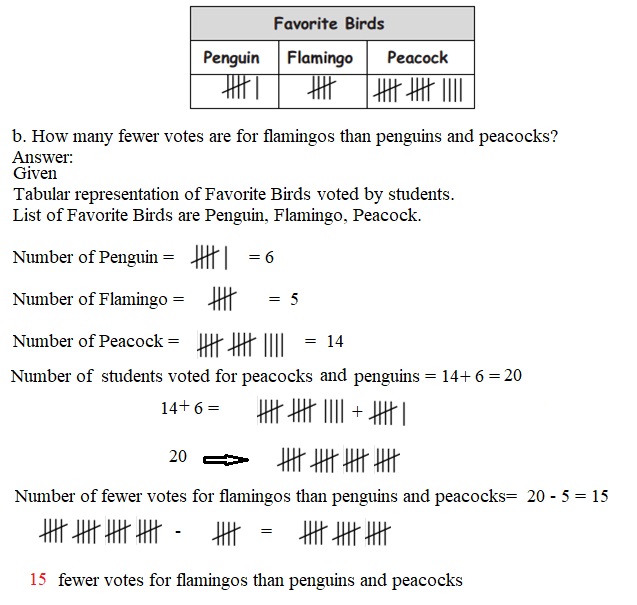
Question 2.
Use the data of Mr. Clark’s class vote to create a picture graph in the space provided.
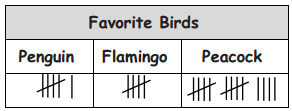
Title: __________

Legend: _________
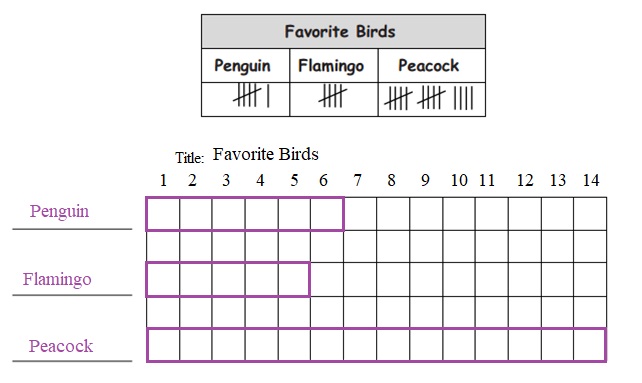
a. How many more students voted for peacocks than penguins?
Answer:
b. How many fewer votes are for flamingos than penguins and peacocks?
Answer:
c. Write and answer your own comparison question based on the data.
Question: _______
Answer: ________
Answer: