Engage NY Eureka Math Algebra 1 Module 5 End of Module Assessment Answer Key
Eureka Math Algebra 1 Module 5 End of Module Assessment Task Answer Key
Question 1.
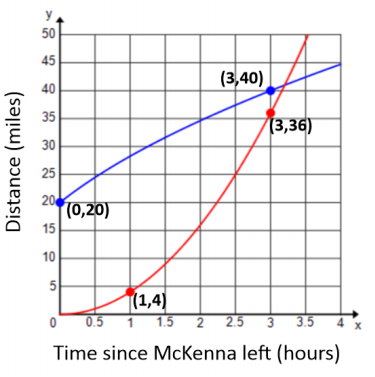
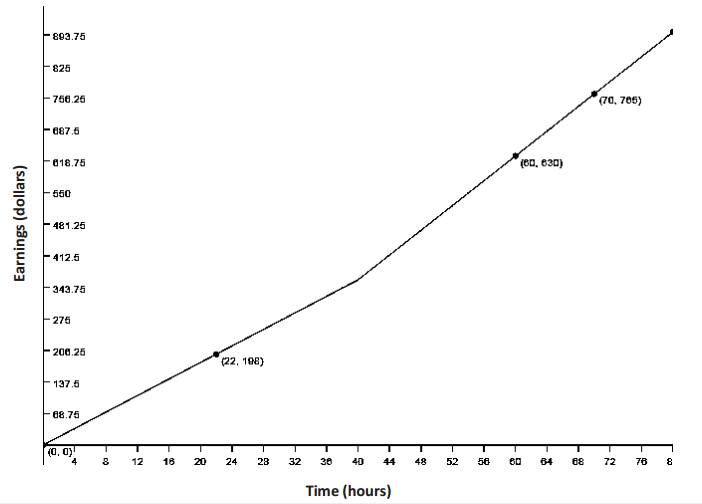
In their entrepreneurship class, students are given two options for ways to earn a commission selling cookies. For both options, students will be paid according to the number of boxes they are able to sell, with commissions being paid only after all sales have ended. Students must commit to one commission option before they begin selling.
Option 1: The commission for each box of cookies sold is 2 dollars.
Option 2: The commission will be based on the total number of boxes of cookies sold as follows: 2 cents is the total commission if one box is sold, 4 cents is the commission if two boxes are sold,
8 cents if three boxes are sold, and so on, doubling the amount for each additional box sold. (This option is based upon the total number of boxes sold and is paid on the total, not each individual box.)
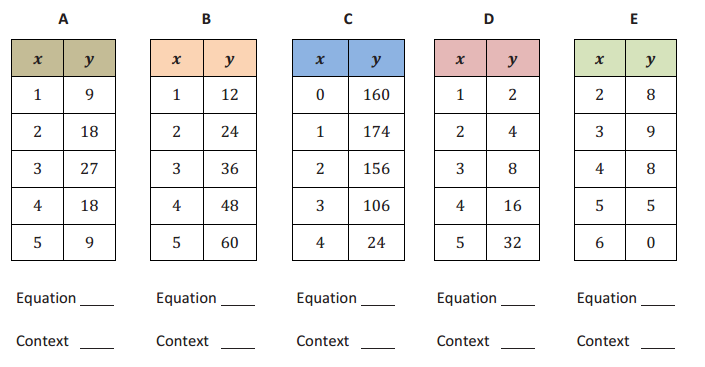
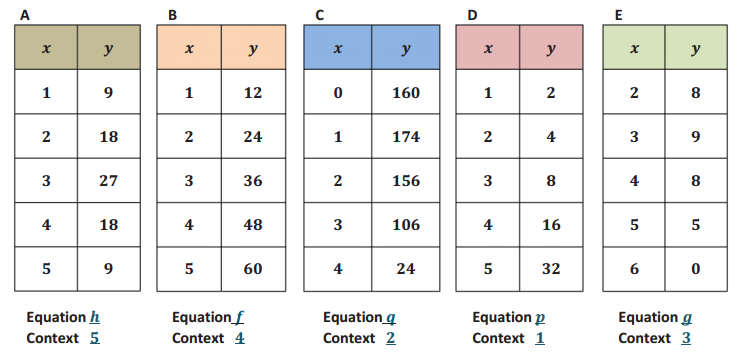
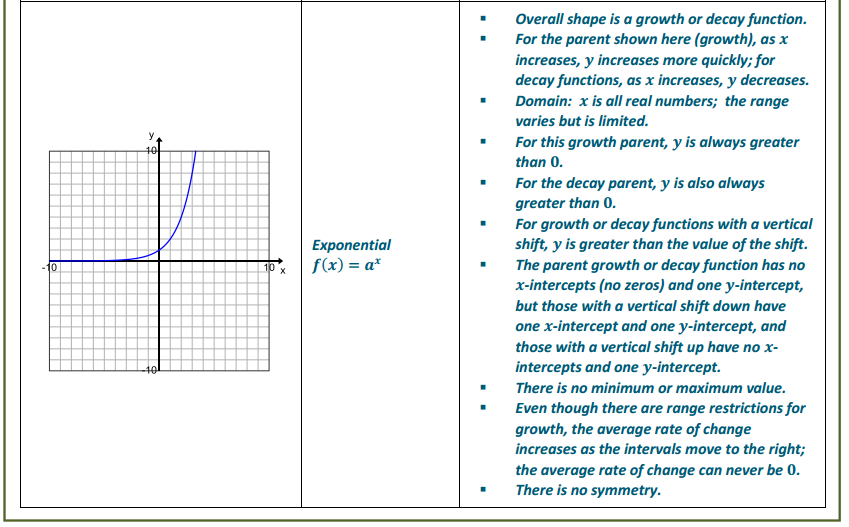
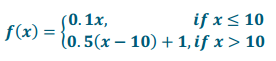
a. Define the variables and write function equations to model each option. Describe the domain for each function.
Answer:
Let C represent the commission for each option in dollars for Option 1 and in cents for Option 2. (Note: Students may try to use 0.02 for the exponential base but will find that the decimals present problems. They might also use 200 for Option 1 so that both can use cents as the unit. However, as long as they are careful, they can use different units for each function.)
Let x represent the number of boxes sold.
C1 = 2x (in dollars)
C2 = 2x (in cents)
Domain: Positive integers
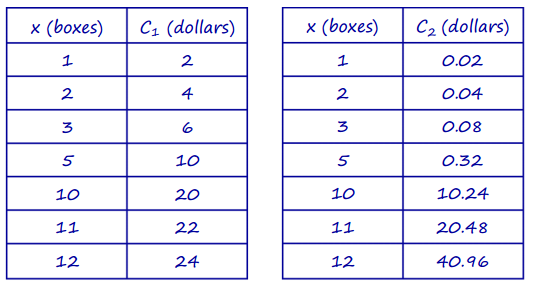
b. If Barbara thinks she can sell five boxes of cookies, should she choose Option 1 or 2?
Answer:
5 boxes
Option 1: C1 = 2(5) = 10
Option 2: C2 = 25 = 32
With Option 1, she will make $10 ; with option 2, she will make 32¢ or $0.32. She should choose Option 1 because she will make more money.
c. Which option should she choose if she thinks she can sell ten boxes? Explain.
Answer:
10 boxes
Option 1: C1 = 2(10) = 20
Option 2: C2 = 210= 1024
With Option 1, she will make $20; with option 2, she will make 1024¢ or $10.24. She should still choose Option 1 because she will make more money.
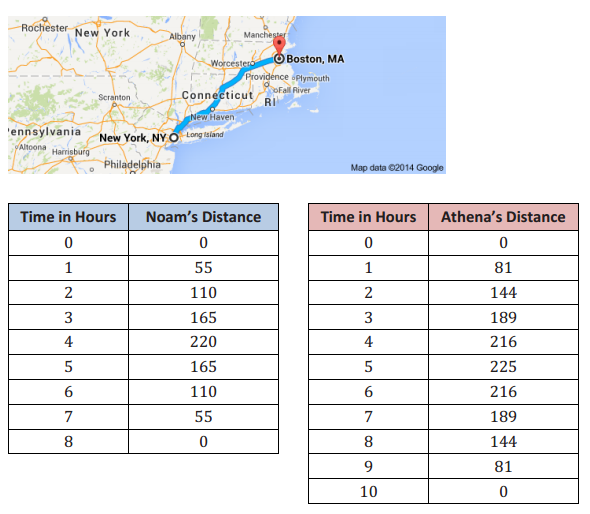
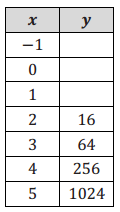
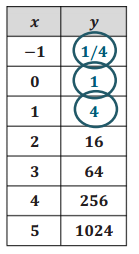
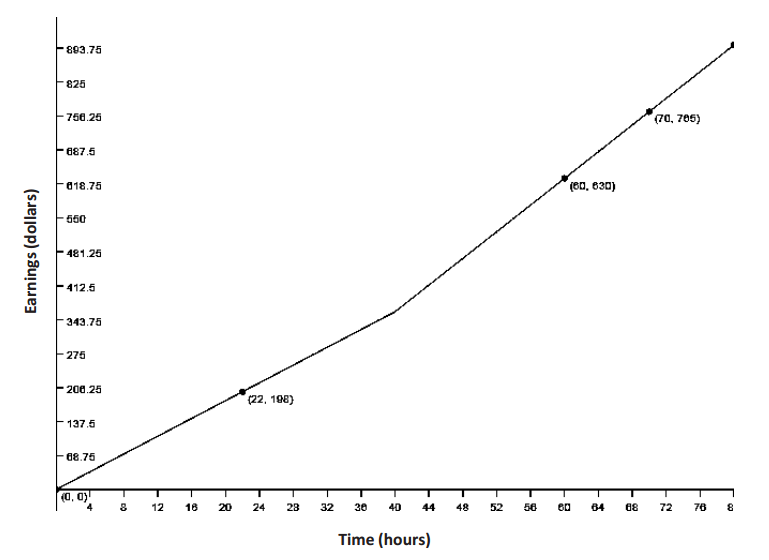
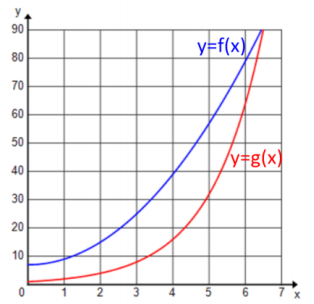
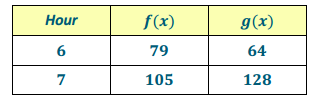
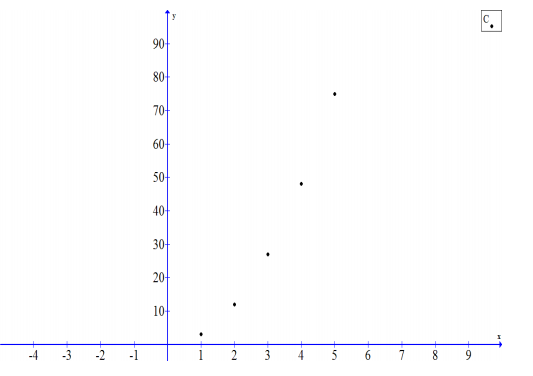
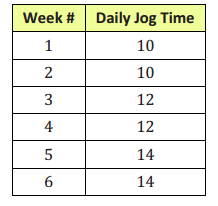
d. How many boxes of cookies would a student have to sell before Option 2 pays more than Option 1? Show your work and verify your answer graphically.

Answer:
Using tables: We see that at 11 boxes Option 1 is still more than Option 2, but after that it reverses.
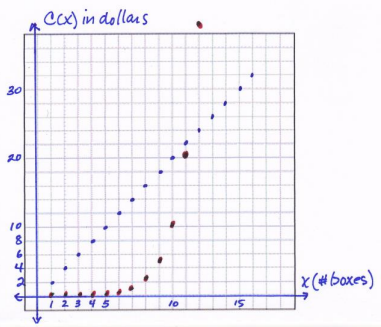
When graphing both functions on the same coordinate plane, it is important to remember to use the same units for both equations and that the graph will be discrete.
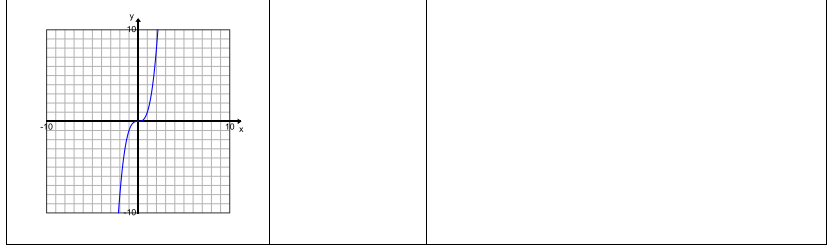
Question 2.
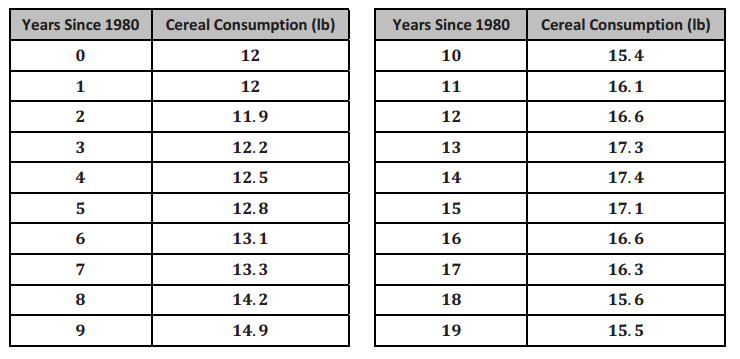
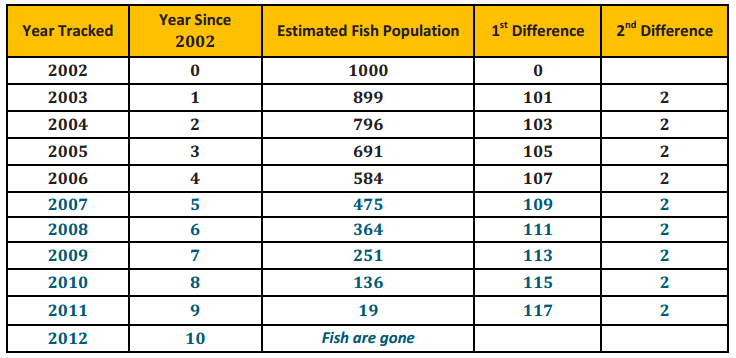
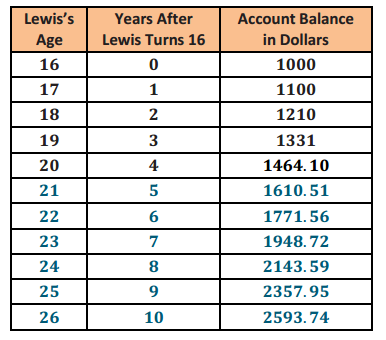
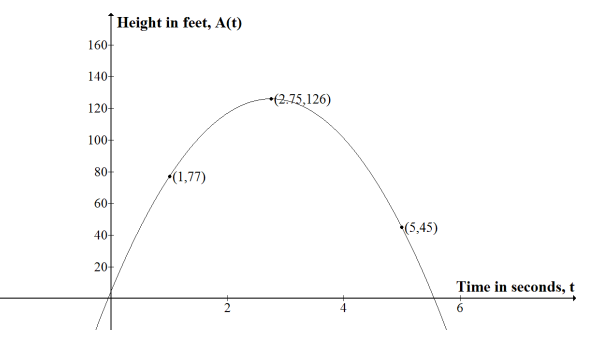
The table shows the average sale price, p, of a house in New York City, for various years, t, since 1960.
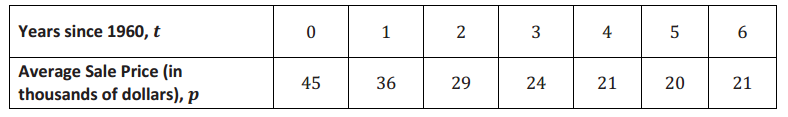
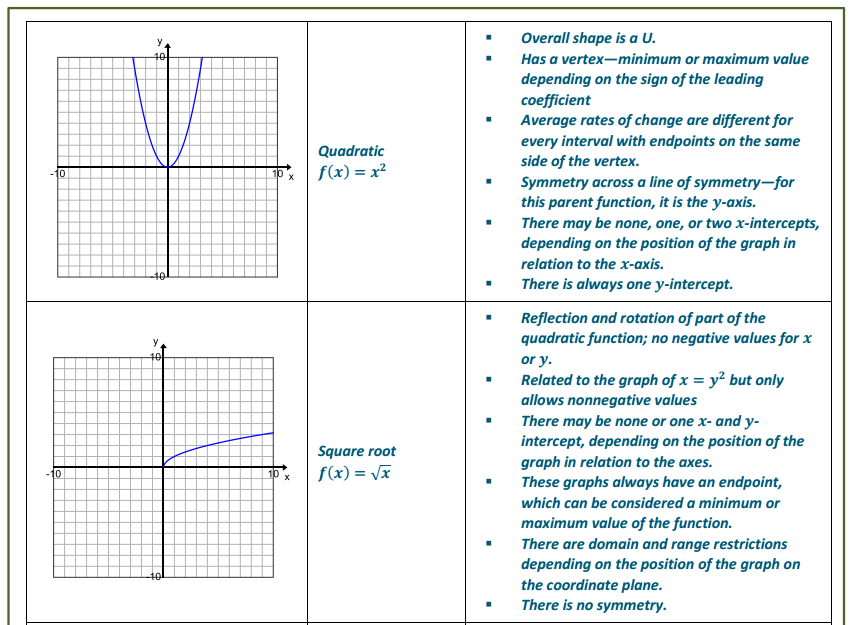
a. What type of function most appropriately represents this set of data? Explain your reasoning.
Answer:
Quadratic The first differences are not the same, but the second differences are the same.
b. In what year is the price at the lowest? Explain how you know.
Answer:
The lowest price was when t = 5 or 1965. The lowest price in the data set is $20, 000; this is the vertex or minimum.
c. Write a function to represent the data. Show your work.
Answer:
We use the general vertex form: f(t) = a(t – h)2+ k …
f(t) =a(t – 5)2+ 20
Substituting an ordered pair that we know, (0, 45), we get
45 = a(–5)2+ 20
45 = 25a + 20
25 = 25a
a = 1
So, f(t) =(t – 5)2+ 20 .
d. Can this function ever be equal to zero? Explain why or why not.
Answer:
No, the lowest price is at the vertex: $20, 000.
e. Mr. Samuels bought his house in New York City in 1970. If the trend continued, how much was he likely to have paid? Explain and provide mathematical evidence to support your answer.
Answer:
1970 would be when t = 10. If we substitute 10 into the function equation in part (c), we get f(10) = (5)2 + 20 = 45. So, he would have paid $45, 000 for his house.
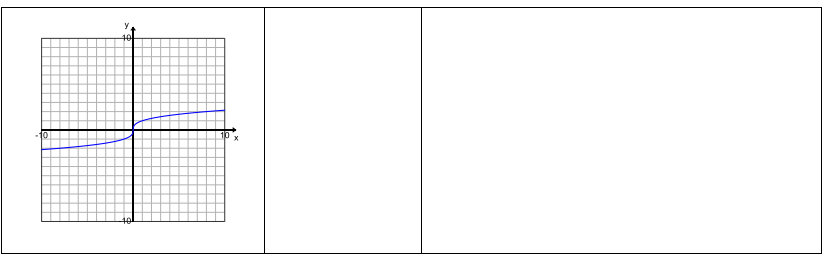
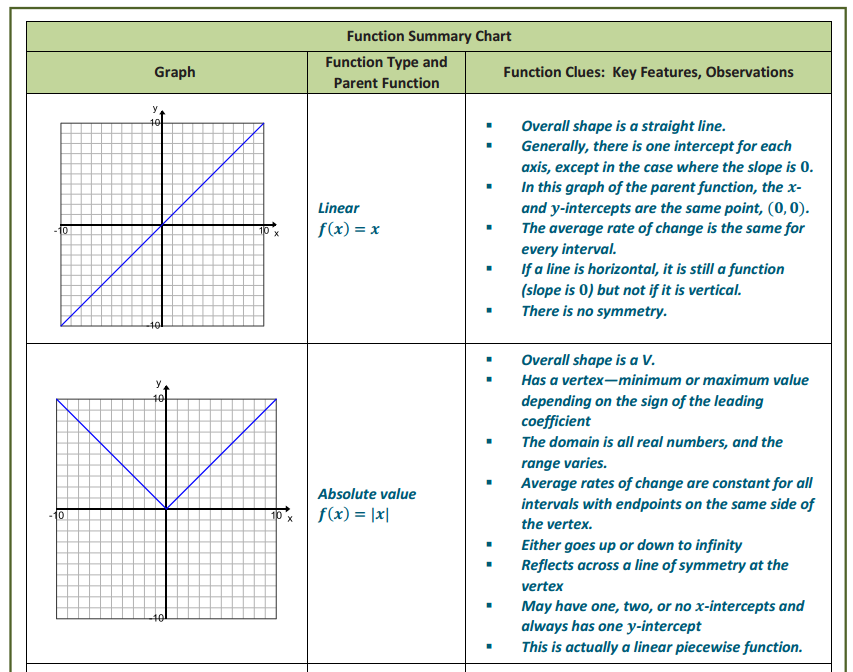
Question 3.
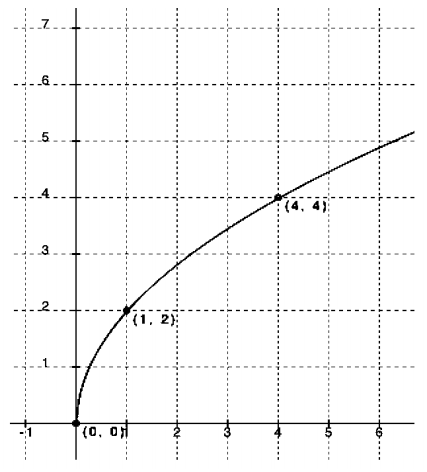
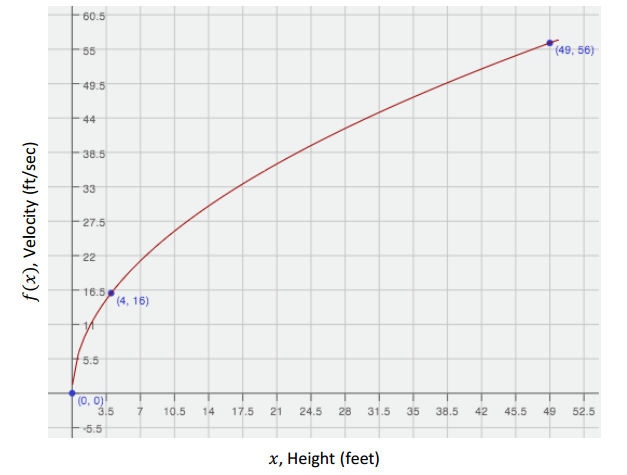
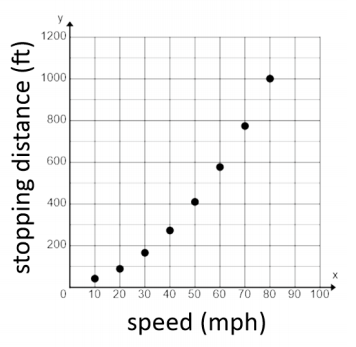
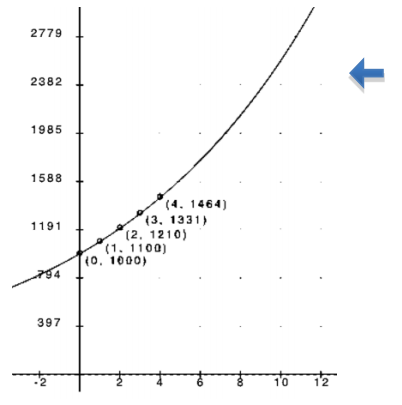
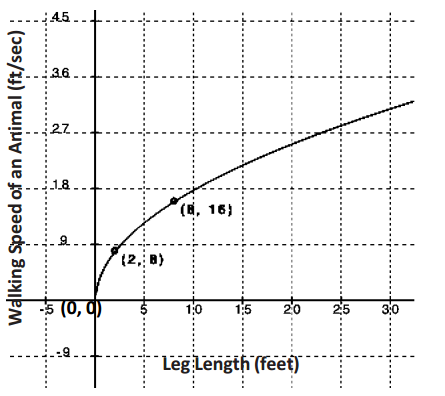
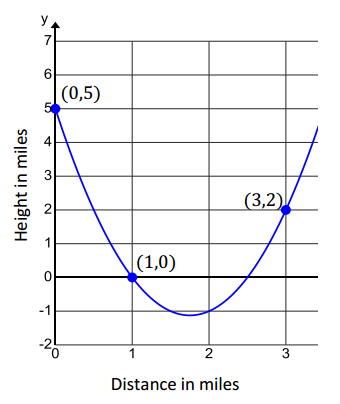
Veronica’s physics class is analyzing the speed of a dropped object just before it hits the ground when it is dropped from different heights. They are comparing the final velocity, in feet/second, versus the height, in feet, from which the object was dropped. The class comes up with the following graph.
a. Use transformations of the parent function, f(x)=\(\sqrt{x}_{\iota}\), to write an algebraic equation that represents this graph. Describe the domain in terms of the context.
Answer:
The graph represents a square root function. The parent function of the square root function is f(x) = \(\sqrt{x}\). From the image of the graph, I can tell the graph has not shifted left or right but, from the points given, it has been stretched. I will use the point (4, 16) to find the symbolic representation of the graph and then use the point (49, 56) to check that my function is correct. The domain is the set of all real numbers greater than or equal to 0. However, realistically there is a limit to how big the numbers can go since there are limits to the heights from which an object can be dropped.
f(x)=\(\sqrt{ax}\), → 16 =\(\sqrt{a 4}\) → 16 = 2\(\sqrt{a}\) → \(\frac{16}{2}\) =\(\sqrt{a}\) → 8 =\(\sqrt{a}\) → 64 = a
(Note: Starting with f(x) = a\(\sqrt{x}\), will reach the same end result.)
Check:
f(x)=\(\sqrt{64x}\) → f(x) = 8\(\sqrt{x}\) → 56 = 8\(\sqrt{49}\) → 56 = 8(7) → 56 = 56 → f(x)= 8\(\sqrt{x}\), (x ≥ 0)
b. Veronica and her friends are planning to go cliff diving at the end of the school year. If she dives from a position that is 165 ft. above the water, at what velocity will her body be moving right before she enters the water? Show your work and explain the level of precision you chose for your answer.
Answer:
f(165) = 8\(\sqrt{165}\) ≈ 102.8 . Her velocity will be approximately 103 ft/sec just before she enters the water. Since the information in the problem is given to the nearest whole number of feet and seconds, I decided to do the same for my answer.
c. Veronica’s friend, Patrick, thinks that if she were able to dive from a 330 ft. position, she would experience a velocity that is twice as fast. Is he correct? Explain why or why not.
Answer:
He is not correct. Patrick is describing the relationship between the velocity and the height as if it were a linear function, but it is not. The graph that represents the relationship between the two is a square root, which has average rates of change on different intervals that are different from a linear function. I rounded to the nearest whole number because this is a model and only approximates a real-world phenomenon. f(330 ) = 8\(\sqrt{330}\) = 145.3 . Her velocity would be approximately 145 ft/sec which is not double the 103 ft/sec speed calculated before.
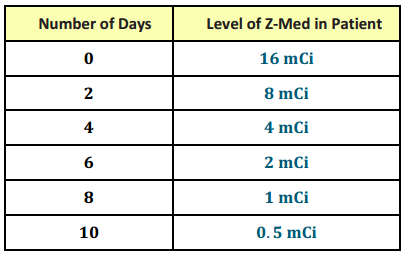
Question 4.
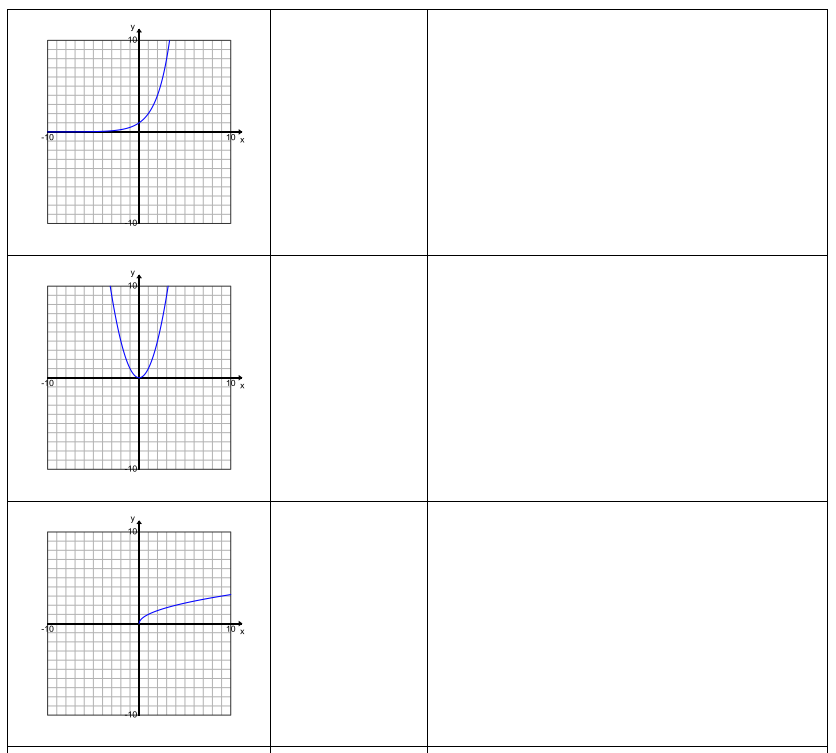
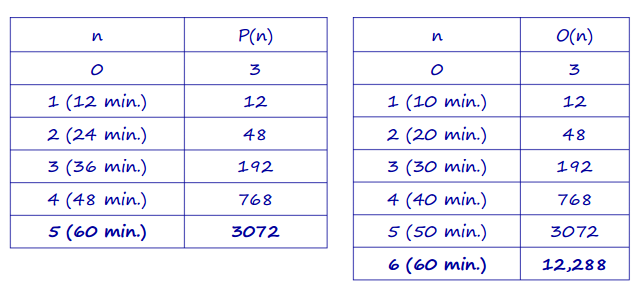
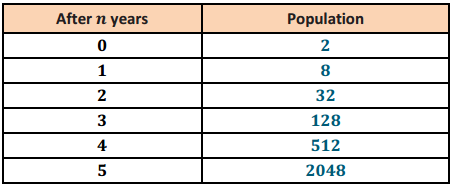
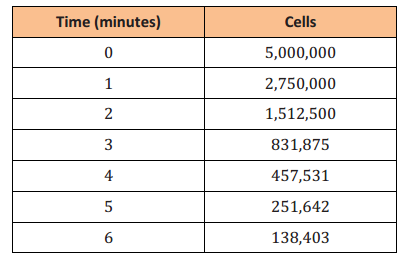
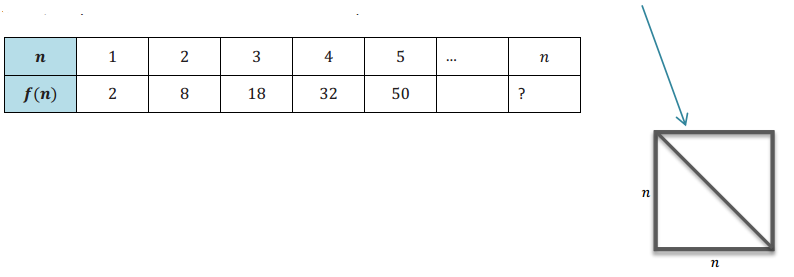
Suppose that Peculiar Purples and Outrageous Oranges are two different and unusual types of bacteria. Both types multiply through a mechanism in which each single bacterial cell splits into four. However, they split at different rates: Peculiar Purples split every 12 minutes, while Outrageous Oranges split every 10 minutes.
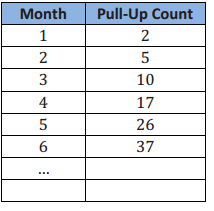
a. If the multiplication rate remains constant throughout the hour and we start with three bacterial cells of each, after one hour, how many bacterial cells will there be of each type? Show your work and explain your answer.
Answer:
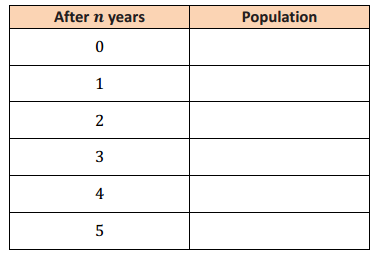
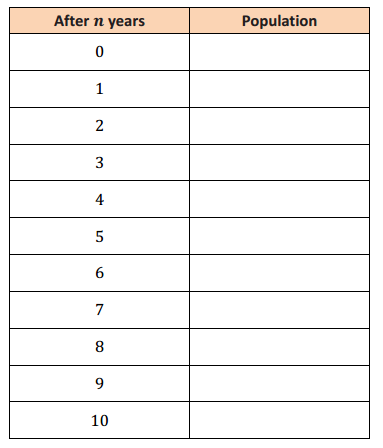
Let n = the number of 10 -minute or 12 -minute time intervals. Then P(n) represents the number of Purples and O(n) represents the number of Oranges at the end of any time period. The tables below show the number of bacterial cells after 1 hour for each:
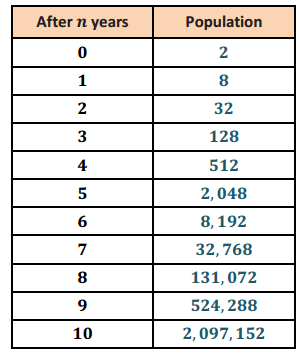
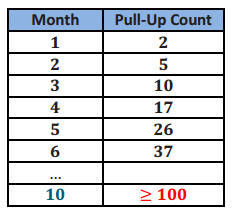
b. If the multiplication rate remains constant for two hours, which type of bacteria is more abundant? What is the difference between the numbers of the two bacterial types after two hours?
Answer:
Continuing the table from part (a) we find that the Oranges will have one more split in the first hour, so two more after two hours. The Oranges will have 47, 185, 920 more bacterial cells than the Purples. (At 2 hours, Oranges = 50, 331, 648 and Purples = 3, 145, 728.)
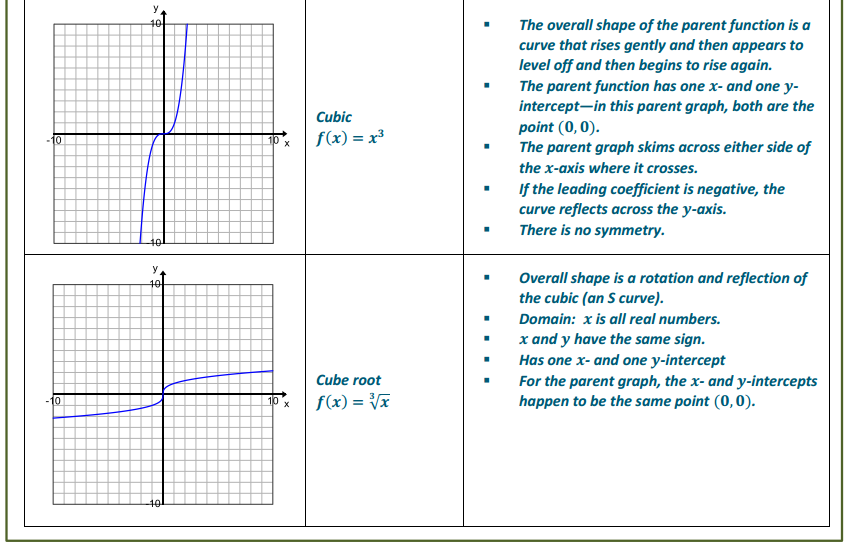
c. Write a function to model the growth of Peculiar Purples and explain what the variable and parameters represent in the context.
Answer:
P(n) = 3(4n) , where n represents the number of 12 -minute splits, 3 is the initial value, and 4 is the number of Purples created for each split.
d. Use your model from part (c) to determine how many Peculiar Purples there will be after three splits (i.e., at time 36 minutes). Do you believe your model has made an accurate prediction? Why or why not?
Answer:
P(3) = 3(43) = 3(64) = 192. Yes, this matches the values I found in the table for part (a).
e. Write an expression to represent a different type of bacterial growth with an unknown initial quantity but in which each cell splits into two at each interval of time.
Answer:
F(n) = a(2n), where n represents the number of time interval and a represents the initial number of bacterial cells.
Question 5.
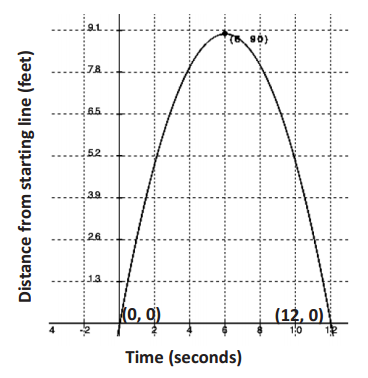
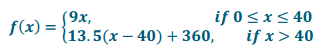
In a study of the activities of dolphins, a marine biologist made a slow-motion video of a dolphin swimming and jumping in the ocean with a specially equipped camera that recorded the dolphin’s position with respect to the slow-motion time in seconds. Below is a piecewise quadratic graph, made from the slow-motion dolphin video, which represents a dolphin’s vertical height (in feet, from the surface of the water) while swimming and jumping in the ocean, with respect to the slow-motion time (in seconds). Use the graph to answer the questions. (Note: The numbers in this graph are not necessarily real numbers from an actual dolphin in the ocean.)
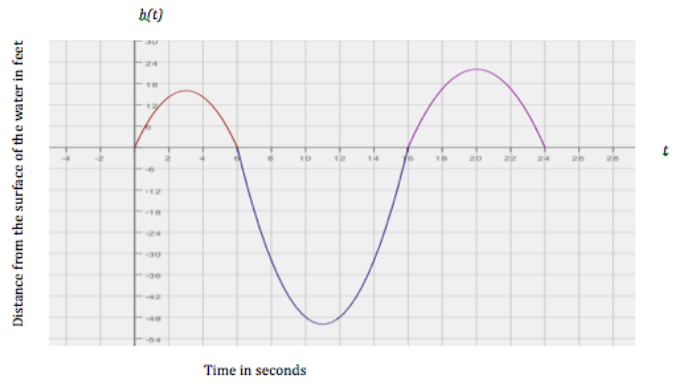
a. Given the vertex (11, -50), write a function to represent the piece of the graph where the dolphin is underwater. Identify your variables and define the domain and range for your function.
Answer:
Using the vertex form for a quadratic function equation: h(t) = a(t – h)2 + k , we know the vertex (h, K) to be (11, -50) . Now, to find the leading coefficient, we can substitute a point we know, say (6, 0) , and solve for a :
0 = a (6 – 11 )2 – 50
a (- 5) 2 = 50
25a = 50
a = 2
So, h(t) = 2(t – 11) 2 – 50
Domain (interval of time in seconds): [6, 16]
Range (distance from the surface): [-50, 0]
b. Calculate the average rate of change for the interval from 6 to 8 seconds. Show your work and explain what your answer means in the context of this problem.
Answer:
Average rate of change:
\(\frac{h(8)-h(6)}{8-6}\) = \(\frac{-32-0}{2}\) = -16
The dolphin is moving downward at an average rate of 16 feet per second.
c. Calculate the average rate of change for the interval from 14 to 16 seconds. Show your work and explain what your answer means in the context of this problem.
Answer:
Average rate of change:
\(\frac{h(16)-h(14)}{16-14}\) = \(\frac{0- -32}{2}\) = + 16
The dolphin is moving upward at a rate of 16 feet per second.
d. Compare your answers for parts (b) and (c). Explain why the rates of change are different in the context of the problem.
Answer:
The two average rates show that the dolphin’s rate is the same for each interval except that in the first it is moving downward and in the second upward. They are different because of the symmetric nature of the quadratic graph. The intervals chosen are symmetric, so they will have the same y-values.
Question 6.
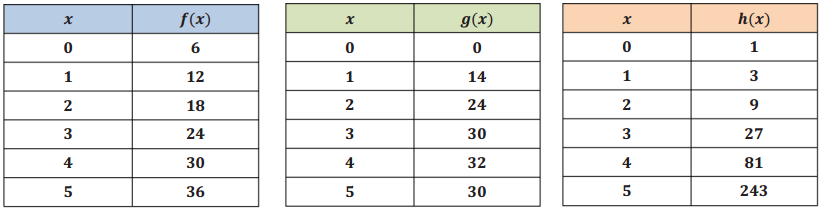
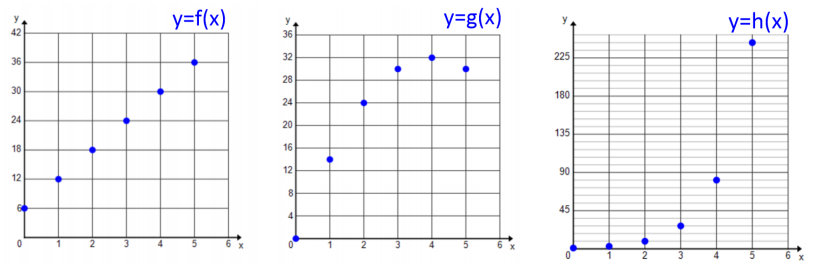
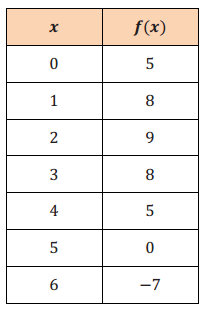
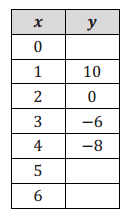
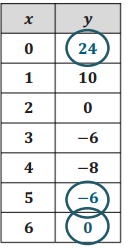
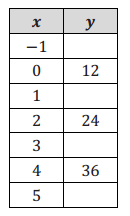
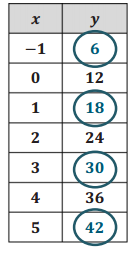
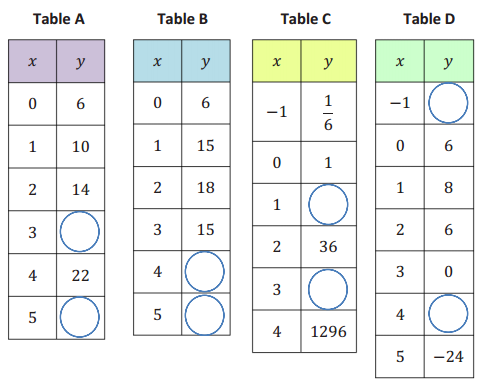
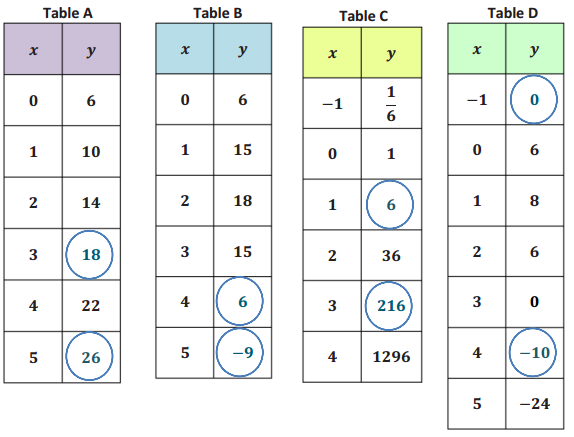
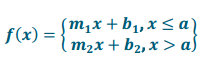
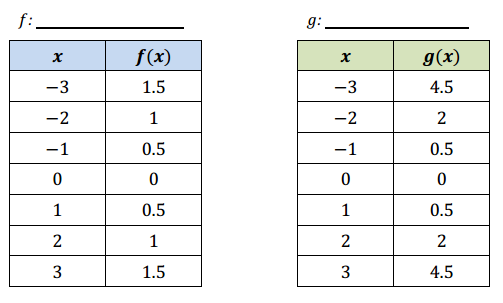
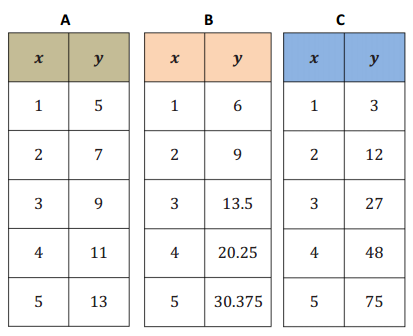
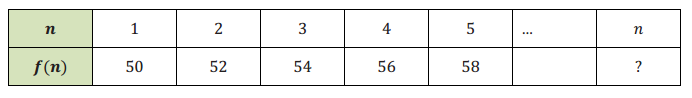
The tables below represent values for two functions, f and g, one absolute value and one quadratic.
a. Label each function as either absolute value or quadratic. Then explain mathematically how you identified each type of function.
Answer:
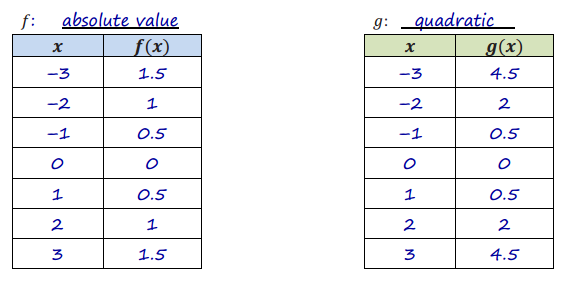
In the first table (f(x)) the rates on any interval on the same side of the vertex (0, 0) is – \(\frac{1}{2}\) , and on the other side of the vertex the rates of change are all \(\frac{1}{2}\) .
In the second table (g(x)) the rates vary on each side of the vertex: The intervals closest to the vertex have average rates of – \(\frac{1}{2}\) and \(\frac{1}{2}\), but the next intervals have –1.5 and +1.5, then -2.5 and +2.5, etc.
For this reason, the first is absolute value (linear piecewise) and the second is quadratic.
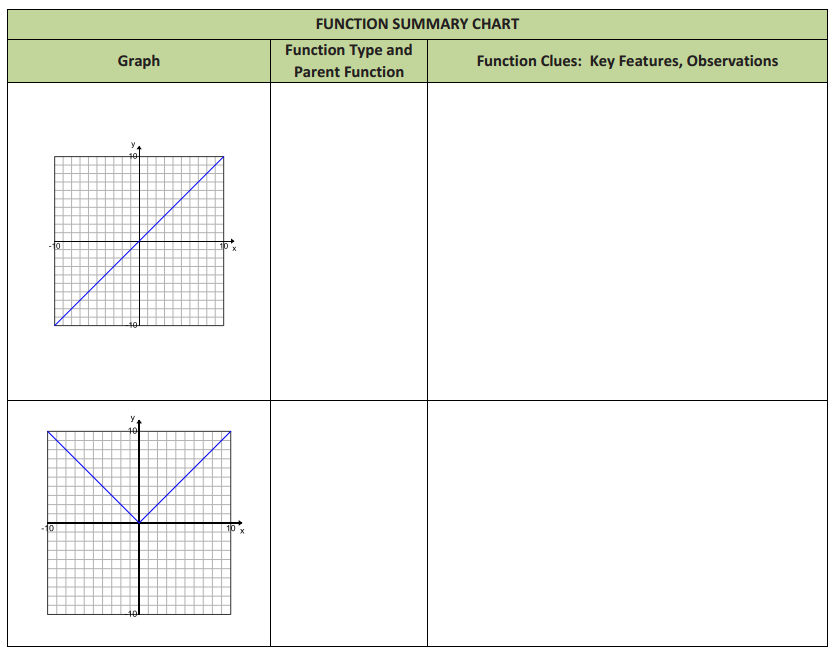
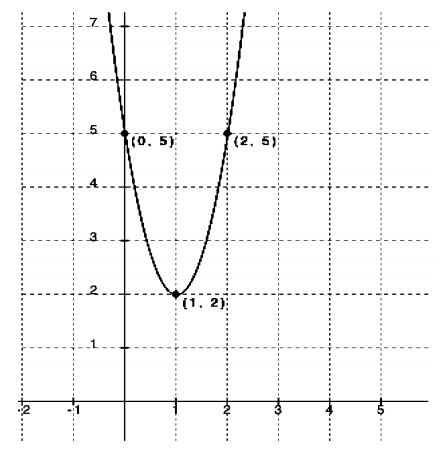
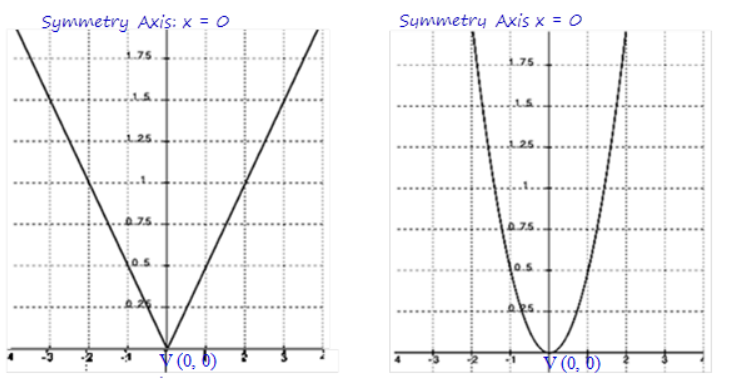
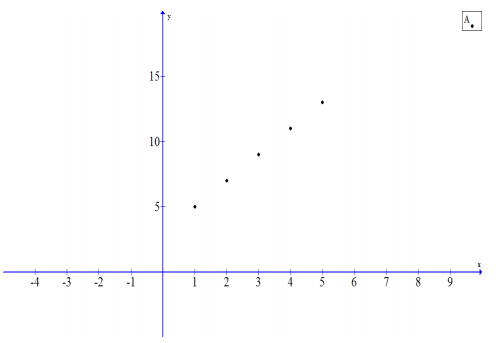
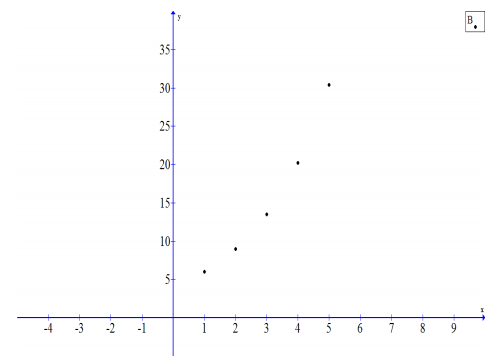
b. Represent each function graphically. Identify and label the key features of each in your graph (e.g., vertex, intercepts, axis of symmetry).

Answer:
c. Represent each function algebraically.
Answer:
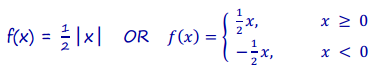
g(x) = a(x – h) 2 + k with V(0, 0)
So, g(x) = ax 2.
Substituting an ordered pair we know, (2, 2):
2 = a(2) 2
a = \(\frac{1}{2}\)
So, g (x ) = \(\frac{1}{2}\) x 2 .
(Note: Since it is obvious that the quadratic function is not translated, the equation could be found by using y = ax 2 in the first step.)


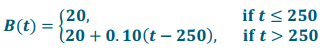 where t represents the number of texts per month