Problems on Median of Ungrouped Data

Problems on Median of Ungrouped Data | Median of Raw Data Questions and Answers PDF

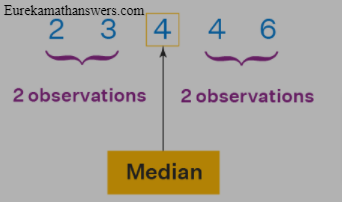
The middle value of an ordered data set is called the median of ungrouped data. To find the median of raw data, you need to arrange the given data in ordered form (ascending or descending order) and then consider the middle number as a median. If you want to practice more Problems on Median of Ungrouped Data then go with this article. Here, we have listed some of the practice questions on calculating the median of raw data. Assess your knowledge gap by solving them on a daily basis and enhance your problem-solving & conceptual skills in the Statistics concepts.

Do Check:

Median of Ungrouped Data Word Problems with Solutions

Example 1: 
Find the Median for an odd number of values: 12; 15; 56; 23; 48; 79; 5
Solution: 
Step 1: Firstly, we have to sort the values in the data set from the smallest to the largest;
5, 12, 15, 23, 48, 56, 79
Step 2: Find the number in the middle to get the median of the data. Here median is the fourth positioned value of the data set ie., 23.
Hence, the median of these odd raw data is 23.

Example 2: 
Find the median of the following data set: {3; 14; 10; 14; 15; 5; 3; 10; 12; 13}
Solution: 
First, we have to order the data set: 3, 3, 5, 10, 10, 12, 13, 14, 14, 15
Since the given number of observations is 10 then the median lies between the fifth and sixth place:
Median = 10+12 / 2 = 22/2 = 11
Therefore, the median of the ungrouped data set is 11.

Example 3:
The median of observation 13, 15, 17, 19, x + 3, x + 5, 31, 33, 35, 41 arranged in ascending order is 25. Find the values of x.
Solution:
The given data is in ascending order.
The number of variants of the given data is 10
Median is the average of the 5th and 6th observations ie.,
[(x + 3) + (x + 5)]/2 = 25
2x+8/2 = 25
2x+8 = 50
2x= 42
x = 42/2
x = 21
Therefore, the value of x is 21.

Example 4:
The median of a set of 7 distinct observations is 18. If each of the largest 3 observations of the set is increased by 4, then what is the median of the new set?
Solution:
Given n = 7
Median = 18
Median term = [(n+1)/2]th term = [(7+1)/2]th term = 4th term
Given the largest 3 observations are increased by 4. Considering the median is the 4th term, there will be no change in it.
Hence, Remains the same as that of the original set.

Example 5:
The following data were obtained about the time that four students took for completing a running race. Find the Median of the racing time: 8.7hrs, 4.3hrs, 3.5hrs, 5.1hrs
Solution:
First, let us sort the data in ascending order: 3.5hr, 4.3hr, 5.1hr, 8.7hr
The number of observations on the data set is 4, which is even
So, we can find the median by taking the mean of two middlemost numbers.

Median = Mean of (4.3hr, 5.1hr)
= 4.3+5.1 / 2
= 9.4/2
= 4.7
Hence, the median race time is 4.7 hrs.

Example 6:
The test scores (out of 20 points) of 25 students in a Statistics class are 12, 15, 10, 9, 8, 6, 12, 13, 19, 20, 18, 14, 15, 6, 5, 10, 12, 15, 6, 7, 9, 13, 17, 18, 20 . Find the median of the test scores.
Solution:
Given Scores are 12, 15, 10, 9, 8, 6, 12, 13, 19, 20, 18, 14, 15, 6, 5, 10, 12, 15, 6, 7, 9, 13, 17, 18, 20
Let’s arrange it in ascending order: 5, 6, 6, 6, 7, 8, 9, 9, 10, 10, 12, 12, 12, 13, 13, 14, 15, 14, 17, 18, 18, 19, 19, 20, 20.
The number of observations are 25, which is odd
Median of the test scores = n+1/2
= 25+1/2
= 26/2
= 13th Observation
= 12.
Hence, the median of the test scores is 12.

Worksheet on Comparison between Rational Numbers

Worksheet on Comparison between Rational Numbers | Comparing Rational Numbers Worksheet PDF

If you would like to practice questions on Comparing Rational Numbers then the Worksheet on Comparison between Rational Numbers can be extremely helpful for you. Comparing Rational Numbers Worksheet will have problems on arranging rational numbers in ascending order, descending order, finding the greatest or smallest rational number, etc. Identify your knowledge gap and improve on the areas you are lagging accordingly by solving the problems from the Comparison of Rational Numbers Practice Worksheet PDF.

Read More:

Comparing and Ordering Rational Numbers Worksheet Answer Key PDF

Example 1.
Compare 4/3 and 8/3?

Solution:

Given Rational Numbers are 4/3 and 8/3
Since the above rational numbers are like fractions we just need to simply check the numerator and the one having a larger numerator is greater.
8>4
Therefore, 8/3 is greater.


Example 2.
Akbar and Suhas are taxi drivers. Akbar started his journey at 7:30 a.m. and stopped at 8:30 a.m. by covering a distance of 30 km. On the other hand, Suhas traveled 40 km in 2 hours. Assuming that they travel at a constant speed, compare the distances traveled by them in the first hour of their journey.

Solution:

Since Akbar traveled for 1 hr we need not do any calculation further
Suhas traveled a distance of 40 km in 2hr thus for 1 hr he travels 20 Km
Akbar travels a distance of 30km in 1st 1 hr of the journey
Suhas travels a distance of 20km in 1st 1 hr of the journey.
Therefore, Akbar traveled more distance compared to Suhas.


Example 3.
Compare and order the rational numbers 3/7, 4/10, 7/11 in ascending order?

Solution:

Given Rational Numbers are 3/7, 4/10, 7/11
Firstly, let us make the denominators equal to compare the given unlike fractions.
LCM(7,10,11) = 770
Equating the denominators we have
3/7 = 3*110/7*110 = 330/770
4/10 = 4*77/10*77 = 308/770
7/11 = 7*70/11*70 = 490/770
Now compare the numerators of the fractions obtained.
308<330<490
Thus, 4/10 <3/7 <7/11


Example 4.
Compare the rational numbers 4/6 and 3/-4?

Solution:

Given Rational Numbers are 4/6 and 3/-4
Let us make the denominators positive by multiplying both numerator and denominator with -1 i.e. 3/-4 = 3*-1/-4*-1 = -3/4
Since the given fractions are unlike fractions let us find the LCM of Denominators
LCM(6, 4) = 12
4/6 = 4*2/6*2 = 8/12
-3/4 = -3*3/4*3 = -9/12
Compare the numerators
8>-9
Thus, 4/6 is greater.


Example 5.
Compare each pair of rational numbers with > < =?
(i)6/7 ………9/7
(ii)8/9 ……..6/4
(iii)4/6 ………2/3

Solution:

(i)6/7 ………9/7
Given Rational Numbers are Like Fractions. To check which one is greater let us see the numerators.
6<9
Therefore, 6/7 is less than 9/7 i.e. 6/7……<…….9/7
(ii)8/9 ……..6/4
Given Rational Numbers are Unlike Fractions. We have to equate the denominators to tell which one is greater or smaller.
LCM(9, 4) = 36
8/9 = 8*4/9*4 = 32/36
6/4 = 6*9/4*9 = 54/36
Comparing Numerators we can say 8/9 ……<…… 6/4
(iii)4/6 ………2/3
Given Rational Numbers are 4/6 and 2/3
4/6 reduced gives the same fraction 2/3
Thus, 4/6 ……=…… 2/3


Example 6.
Compare the rational numbers 0, -5/4, 3/2 and arrange them from smallest to largest?

Solution:

Given Rational Numbers are 0, -5/4, 3/2
-5/4 is a negative number
3/2 is a positive number
-5/4 <0 <3/2 is the rational numbers from smallest to largest.


Example 7.
Which of the following rational numbers in each of the following pairs is smaller
(i)(-6)/(-13) or 9/13
(ii)7/8 or -8/8

Solution:

(i) (-6)/(-13) or 9/13
Given Rational Numbers are (-6)/(-13) or 9/13
Since both are like fractions the one with a lesser numerator is a smaller fraction.
Since 6 <9, (-6)/(-13) is smaller than 9/13 i.e. (-6)/(-13) <9/13
(ii) 7/8 or -8/8
Given Rational Numbers are 7/8 or -8/8
Since both are like fractions we will check the numerator.
-8 <7
Therefore, -8/8 is a smaller fraction.


Example 8.
Which rational numbers in each of the following pairs of rational numbers are greater?
(i) 3/8 or 0
(ii) (-6)/8 or 0
(iii) (-4)/7 or 0
(iv) 5/3 or 0
(v) (-3)/2 or 2/2

Solution:

(i) 3/8 or 0
3/8 is greater than 0
(ii) (-6)/8 or 0
In a negative number and zero, 0 is greater. Therefore (-6)/8 < 0
(iii) (-4)/7 or 0
In a negative number and zero, 0 is greater. Therefore (-4)/7 < 0
(iv) 5/3 or 0
5/3 >0
(v) (-3)/2 or 2/2
2/2 >-3/2


Worksheet on Recurring Decimals as Rational Numbers

Worksheet on Recurring Decimals as Rational Numbers | Converting Recurring Decimals to Rational Numbers Worksheet PDF

Recurring Decimals are the ones that are non-terminating but have repeating digits next to the decimal point. In this Worksheet on Recurring Decimals as Rational Numbers, we will have different kinds of problems for recurring decimal to rational number conversion.

Practice questions from Converting Recurring Decimals to Rational Numbers Worksheet PDF and improve your problem-solving ability. Answer the Recurring Decimal to Rational Numbers Questions and Answers regularly to build confidence and attempt the exams carefully to score well.

See More:

Converting Recurring Decimals to Rational Numbers Worksheet with Answers

Example 1.
Write the decimal 0.825 as a rational number?

Solution:

Given Decimal Number is 0.825
To write 825 thousandths we use place 825 over 1000
= 825/1000
Simplifying the fraction further we have 33/40


Example 2.
Convert 2.333… into a rational number?

Solution:

Given Recurring Decimal is 2.333…..
Place the repeating digit on the left side of the decimal point. To do so move it by multiplying the original number by 10.
10x = 23.333…..
x= 2.333……
10x-x =23.333….-2.333….
9x=21
x=21/9
Therefore, recurring decimal to a rational number is 21/9


Example 3.
Convert 10.3454545… into a rational number?

Solution:

Given Recurring Decimal x= 10.3454545……..
Place the repeating digit on the left side of the decimal point. To do so move it by multiplying the original number by 1000.
1000x = 10345.454545…..
Shift the repeating digits to the right side of the decimal point. Simply multiply with 10
10x= 103.4545……
1000x-10x =10345.454545…..- 103.4545……
990x=10242
x=10242/990
x=569/55
Therefore, recurring decimal to a rational number is 569/55


Example 4.
Convert the following repeating decimal 0.272727 as a rational number?

Solution:

Given Repeating Decimal x = 0.272727…..
Place the repeating decimal on the left side of the decimal point. Simply multiply the original number by 100
100x = 27.2727….
x = 0.272727……
Subtracting both the equations we have
100x-x=27.272727…….-0.272727…..
99x=27
x =27/99


Example 5.
Convert the following repeating decimal as fraction 0.37777

Solution:

Given repeating decimal = 0.37777…….
Place the repeating digit on the left side of the decimal point. To do so multiply the original number by 10
10x = 3.77777…..
x = 0.37777….
10x-x = 3.777….-0.37777….
9x =3.4
x=3.4/9
x=34/90
x=17/45


Example 6.
Convert 124.45757… into the rational fraction?

Solution:

Given Repeating Decimal x = 124.45757….
Move the repeating digit to the left side of the decimal point at first. To do so multiply with 1000
1000x = 124457.575…..
Now we need to transfer the repeating digits of decimal numbers to the right side of the decimal point. Simply multiply with 10
10x =1244.5757……
Subtracting both the equations we have
1000x-10x = 124457.575….. – 1244.5757……
990x= 123213
x=123213/990
x=41071/330
Therefore, recurring decimal 124.45757… converted to a rational number is 41071/330


Median of Raw Data

Median of Raw Data – Definition, Formula, How to Find It | Example Problems on Median of Ungrouped Data with Solutions

In statistics, Data is classified into two types ie., Grouped data and Ungrouped data. Ungrouped data is the information ie., characteristics or numbers that are not segregated into any groups or categories. Median is one of the most important measures in central tendency in statistics. Want to know more about the median of raw data? jump into the further modules and get to learn what is statistics median, the formula of Median, how to calculate median of ungrouped data, and solved examples of Median of discrete data.

Do Refer:

Median of Raw Data – Definition

The Median of Raw Data is the middlemost number in the data set achieved after ordering the data from small to big in two equal parts. Also, it is the number that is halfway into the dataset.

For example, let’s assume the set of raw data: 6, 4, 3, 4, 2 to find the median. Now, arrange the data in ascending order: 2, 3, 4, 4, 6 and find the n observations ie., n=5 here n is odd then media of raw data is middle value i.e. 4. Therefore, 4 is the median of the given dataset.

median of ungrouped data example

Median Formula for Ungrouped Data

  • The formula of Median = [(n+1)/2]th observation, if n is odd.
  • The formula to find median of ungrouped data if n is even is M = \(\frac { 1 }{ 2 } \) { (n/2)th+(n/2+1)th}

Method to Calculate Median of Ungrouped Data

Step by Step explanation of calculating the median of raw data is given here. Simply, follow the below steps without any fail and learn how to find the median of ungrouped data.

  1. Firstly, arrange the given raw data in ascending or descending order.
  2. Calculate the number of observations in the given data and then it is denoted by n.
  3. An important part of solving the median problems is knowing the n is odd or even to find the median of the data.
  4. If n is odd, the [(n+1)/2]thobservation is the median of raw data.
  5. If n is even, the mean of (n/2)th observation and [(n/2)+1]th observation is the median ie.,

Median = \(\frac { 1 }{ 2 } \) { (n/2)th+(n/2+1)th}

Solved Examples on Calculating the Median of Discrete Data

Example 1:
Find the median of the raw data: 10, 25, 5, 15, 20.

Solution:
Given raw data is 10, 25, 5, 15, 20
Arrange the data in ascending order ie., 5, 10, 15, 20, 25
The number of observations is 5, which is odd.
Hence, Median = \(\frac { 5+1 }{ 2 } \) = \(\frac { 6 }{ 2 } \) = 3rd observation = 15.

Example 2:
Find the median of the following gasoline price: $1.79, $1.61, $1.96, $2.09, $1.84, $1,75, $2.11

Solution:
Given gasoline prices are $1.79, $1.61, $1.96, $2.09, $1.84, $1,75
Organize the data from least to greatest ie., $1.61, $1.75, $1.79, $1.84, $1.96, $2.09
Number of states are 6, which is even
Median = \(\frac { 1 }{ 2 } \) { (n/2)th+(n/2+1)th}
= \(\frac { 1 }{ 2 } \) { (6/2)th+(6/2+1)th}
= \(\frac { 1 }{ 2 } \) {1.79+1.84}
= \(\frac { 1.79+1.84 }{ 2 } \)
= \(\frac { 3.63 }{ 2 } \)
= 1.815
Hence, the median of gasoline prices is $1.81

Example 3:
Let’s consider the data: 34, 67, 87, 23, 12, 55, 8. What is the median?

Solution:
Given data is 34, 67, 87, 23, 12, 55, 8
Arrange the data from smallest to highest i.e., 8, 12, 23, 34, 55, 67, 87
The number of variants is 7, which is odd then median = middle value
Hence, Median = 34 (middle value in the data).

FAQs on Median

1. What is the median?

In easy words, the middle value of the given data is called the median in statistics.

2. What is the median formula for continuous data?

If the data is in continuous series then we will take the cumulative frequencies, values from the class-interval (N/2)th term. To find the median for continuous data, we use the formula: M= L – Cf-N1/f × i

3. What is the Median of grouped data formula?

For grouped data, the median of frequency distribution is calculated by the formula: Median = l + [(n/2−cf)/f] × h

4. How to find the Median class of ungrouped data?

Follow the steps given below and calculate the median class for raw data:

1. Firstly, arrange the data values in ascending order.
2. If required use the median formula c = (n + 1)/2 where n is the total number of observations.
3. Look for the value at (n + 1)/2. Use the result in step 2. If c holds a fractional half, it means the average of two values is a median.

Representation of Data

Representation of Data | What is Grouped, Ungrouped & Arrayed Data with Examples | Problems on Statistical Data Representation

In statistics, the representation of data can be done in two types: organized and unorganized data. Knowing the types and methods of data representation in statistics can help kids to solve the measures of central tendency effortlessly. The mean and median of ungrouped data and grouped data can be answered so easily. So, refer to this article and get useful information on statistical data representations. Also, check the difference between grouped data and ungrouped data along with some worked-out examples.

Few Related Articles:

Definition of Data

A collection of information compiled by observations, research measurements, or analysis is known as Data.

What is Representation of Data?

Data representation is the form where data is stored, processed, and transmitted. There are various types to represent the data in mathematical form like decimal number system, binary number system, octal, and hexadecimal number system. In statistics, the statistical data is represented in various methods such as Bar charts, histograms, pie charts, and boxplots.

Depending on the given expression data can be represented in raw (ie., ungrouped) or arrayed or grouped. Let’s dig deep and get some idea on these types of data representation in statistics with example problems.

1. Raw or Ungrouped Data

The data that are gained from direct observation is known as ungrouped data. Ungrouped data is also called raw data. In statistics, the discrete data or unorganized data is called ungrouped data that can be presented in tabular data representation named discrete frequency distribution table.

The major limitation of raw data is computation, analysis and interpretation become difficult. Hence, it is mandatory to organize raw data in a systematic order.

Example on Ungrouped Data: Let’s consider the marks gained by 10 students in science test are:

ungrouped data example

Now, it is in the raw data form. By these observations, can we find the least and highest marks?

Actually yes we can do it as takes less time. But, you can even take less time by arranging them in ascending or descending order. Hence, let’s see the marks arranged in ascending order:

raw data example

Finally, we can easily find the least and highest marks scored in the science test. Therefore, the highest score is 95, and the least score is 25. The class range in this example would be the difference between the highest value and the lowest value

Do Check:

2. Arrayed Data

The data that is arranged in the form of ascending order or descending order is known as arrayed data. This form of data representation is very useful to find ungrouped data problems.

The arrayed form of raw data from the above example can be expressed like this:

raw data example

3. Grouped Data

The data which has been separated in the form of different class intervals or categories is called grouped data. We can present this type of data by using Histograms and frequency tables. Compared to raw data, grouped data accuracy is high when finding the mean and median.

Example of Grouped Data: Let’s consider the following height of students which is in raw data: (171,161,155,155,183,191,185,170,172,177,183,190,139,149,150,150,152,158,159,174,178,179,190,170,143,165,167,187,169,182,163,149,174,174,177,181,170,182,170,145,143)

Now, the above-ungrouped data can be classified into groups and check out the outcome of the grouped data of heights of students from the following table:

grouped data example

Grouped Vs Ungrouped Data

The following image shows the difference between the grouped and ungrouped data. Take a look at it for a better understanding.

grouped data vs ungrouped data

Solved Exampled of Data Representation in Statistics

Example 1:
Find the mean of the following ungrouped distributions:
x:  20 40 60 80 100
f:  10 20 30 40 50

Solution:

xi fi xifi
20 10 20×10=200
40 20 40×20=800
60 30 60×30=1800
80 40 80×40=3200
100 50 100×50=5000
Total ∑fi=150 ∑xifi=10,000

Now, the mean formula is
\(\overline{x}\) =∑xifi/∑fi
⇒ \(\overline{x}\) = 10,000/150
⇒ \(\overline{x}\) = 66.66(approx)
Hence, the required mean of this ungrouped data is 66.66 approximately.

Example 2: 
Arrange the following raw data in the arrayed form of data:
80, 70, 0, 20, 20, 45, 50, 65, 30, 50, 70, 20, 4, 90, 49, 40, 45, 30, 30, 50, 20, 80, 39, 30, 50, 50, 70, 70, 20, 40, 90, 30, 40, 50, 65, 45, 70, 79, 20, 4, 30, 50, 20, 45, 50, 45, 90, 30, 4, 50.
Solution: 
Given ungrouped data is 80, 70, 0, 20, 20, 45, 50, 65, 30, 50, 70, 20, 4, 90, 49, 40, 45, 30, 30, 50, 20, 80, 39, 30, 50, 50, 70, 70, 20, 40, 90, 30, 40, 50, 65, 45, 70, 79, 20, 4, 30, 50, 20, 45, 50, 45, 90, 30, 4, 50.
Now, arrange it in ascending order to form the arrayed data;
4, 4, 4, 20, 20, 20, 20, 20, 20, 20, 30, 30, 30, 30, 30, 30, 30, 39, 40, 40, 40, 45, 45, 45, 45, 45, 49, 50, 50, 50, 50, 50, 50, 50, 50, 50, 65, 65, 70, 70, 70, 70, 70, 79, 80, 80, 90, 90, 90, 90.

Example 3: 
The following table shows the ungrouped data of students’ with their scores. Make this whole collection in the shorter form means in grouped data to understand easily.

Marks Obtained Number of Students
4
20
30
39
40
45
49
50
65
70
79
80
90
4
8
8
2
4
6
2
10
3
6
2
3
5
Total 63

Solution:

The data presented in the above table can be organized in a shorter form by grouping the whole collection as shown below:

Marks Obtained

From 0 to under 20

From 20 to under 40

From 40 to under 60

From 60 to under 80

From 80 to under 100

Number of Students

4

18 (i.e., 8 + 8 +2)

22 (i.e., 4 + 6 + 2 + 10)

11 (i.e., 3 + 6 +2)

8 (i.e., 3 + 5)

The total number of students is 63.

Worksheet on Rational Number as Decimal Numbers

Worksheet on Rational Number as Decimal Numbers | Converting Rational Numbers to Decimals Worksheet PDF

Rational Numbers to Decimal Numbers Worksheet present here will assist students in understanding the concept better. This Worksheet on Rational Number as Decimal Numbers provides ample practice questions to ace up your grip on the concept.

Converting Rational Numbers to Decimals Worksheet will aid you in practicing different kinds of questions on rational numbers to decimals conversion. We will not just provide different questions on the topic but also come up with answers so that you don’t have any difficulty in learning the concept step by step.

Also, Check:

Rational Numbers as Decimals Worksheet

Example 1.
Express \(\frac { 5 }{ 42 } \) as a decimal fraction and correct up to 3 places?

Solution:

Given Rational Number is \(\frac { 5 }{ 42 } \)
To obtain the decimal fraction of the given rational number we need to simply divide the numerator with the denominator. The Long Division Process is such
Long Division of 5 by 42


Therefore, \(\frac { 5 }{ 42 } \) converted to decimal fraction up to 3 places is 0.119


Example 2.
Without actual division, find which of the following fractions are terminating decimals?
(i)\(\frac { 7 }{ 15 } \)
(ii)\(\frac { 130 }{ 256 } \)
(iii)\(\frac { 58 }{ 200 } \)

Solution:

(i)\(\frac { 7 }{ 15 } \)
We Can say if a number is terminating or non-terminating by using the formula below
If the Denominator can be expressed in the form n = 2^m*5^n where m, n =0,1,2…..
Here Denominator = 15
We can’t express 15 in the form of 2^m*5^n so it is a non-terminating decimal.
(ii)\(\frac { 130 }{ 256 } \)
If the Denominator can be expressed in the form n = 2^m*5^n where m, n =0,1,2….. then it is terminating decimal or else a non-terminating decimal
Here Denominator = 256
We can express 256 in the form of 2^m*5^n i.e. 2^7*5^0
Thus, the given fraction is a terminating decimal.
(iii)\(\frac { 58 }{ 200 } \)
If the Denominator can be expressed in the form n = 2^m*5^n where m, n =0,1,2….. then it is terminating decimal or else a non-terminating decimal
Here Denominator = 200
We can express 200 in the form of 2^m*5^n i.e. 2^3*5^5
Thus, the given fraction is a terminating decimal.


Example 3.
If \(\frac {4 }{ 13 } \) is changed into a decimal number then what type of decimal number it is?

Solution:

Given Rational Number is \(\frac {4 }{ 13 } \)
To obtain the decimal fraction of the given rational number we need to simply divide the numerator with the denominator. The Long Division Process is such

Long Division of 4 by 13
\(\frac {4 }{ 13 } \) is a non-terminating decimal.


Example 4.
Write the following fractions as decimal numbers?
(i)\(\frac {1 }{ 3 } \)
(ii)\(\frac {13 }{ 9 } \)
(iii)\(\frac {17 }{ 54 } \)

Solution:

(i)\(\frac {1 }{ 3 } \)
Decimal Representation of 1 by 3
\(\frac {1 }{ 3 } \) converted to a decimal fraction is 0.333…..

(ii) \(\frac {13 }{ 9 } \)
Decimal Representation of 13 by 9

\(\frac {13 }{ 9 } \) converted to decimal fraction is 1.444…..
(iii) \(\frac {17 }{ 54 } \)

Decimal Representation of 17 by 54
\(\frac {17}{ 54 } \) converted to decimal fraction is 0.314


Example 5.
Express \(\frac {8 }{ 23 } \) to decimal form and correct up to 4 places?

Solution:

Here Divisor = 23, Dividend = 8.
Performing Long Division Process we can get the decimal form as follows
Decimal Representation of 23 by 8
\(\frac {8 }{ 23 } \) converted to decimal form is 0.3478


Problems on Representation of Rational Numbers on Number Line

Problems on Representation of Rational Numbers on Number Line | Representing Rational Numbers on Number Line Questions

Every Number can be represented on Number Line. The same applies to Rational Numbers too and we can denote them on Number Line. We have mentioned some of the key points to remember while representing rational numbers on a number line. Go through them and get a clear idea of the concept. Practice the different problems on representation of rational numbers on number line and learn how to represent rational numbers on the number line. Solve them on a frequent basis and enhance your problem-solving skills and proficiency in the subject.

Do Refer:

Rational Numbers on Number Line Questions

Example 1.
Represent 4/3 on Number Line?
Solution:
Given Rational Number is 4/3
Since the given rational number is positive we will represent it on the right side of the zero on the number line. To denote this improper fraction we will first convert it into a mixed fraction.
4/3 converted to mixed fraction = 1 1/3
Now this fraction will lie between 1 and 2. The Number Line between 1 and 2 is split into three equal parts. The first part of the division is the required representation of the fraction. It can be shown as
Representation of Rational Number 1 1 by 3

Example 2.
Represent 6/7 on Number Line?
Solution:
Given Rational Number is 6/7
Since the given rational number is positive we will represent it on the right side of the zero on the number line. To denote this proper fraction we will split the number into 7 equal parts between 0 and 1.
The sixth part of the division is the required representation of the fraction. It can be shown as
Representation of Rational Number 6 by 7

Example 3.
Place -1/2 on Number Line?
Solution:
Given Rational Number is -1/2
Since the given rational number is negative we will represent it on the left side of the zero on the number line. To denote this proper fraction we will split the number into 2 equal parts between 0 and -1.
The second part of the division is the required representation of the fraction. It can be shown as
Representation of Rational Number -1 by 2

Example 4.
Represent -3/5 on Number Line?
Solution:
Given Rational Number is -3/5
Since the given rational number is negative we will represent it on the left side of the zero on the number line. To denote this proper fraction we will split the number line into 5 equal parts between 0 and -1.
The third part of the division is the required representation of the fraction. It can be shown as
Representation of Rational Number -3 by 5

Example 5.
Represent 9/4 on Number Line?
Solution:
Given Rational Number is 9/4
Since the given rational number is positive we will represent it on the right side of the zero on the number line. To denote this improper fraction we will first convert it into a mixed fraction.
9/4 converted to mixed fraction = 2 1/4
Now this fraction will lie between 2 and 3. The Number Line between 2 and 3 is split into four equal parts. The first part of the division is the required representation of the fraction. It can be shown as
Representation of Rational Number 2 1 by 4

Example 6.
Represent 5/3 on Number Line?
Solution:
Given Rational Number is 5/3
Since the given rational number is positive we will represent it on the right side of the zero on the number line. To denote this improper fraction we will first convert it into a mixed fraction.
5/3 converted to mixed fraction = 1 2/3
Now this fraction will lie between 1 and 2. The Number Line between 1 and 2 is split into three equal parts. The second part of the division is the required representation of the fraction. It can be shown as
Representation of Rational Number 1 2 by 3


Frequency of the Statistical Data

Frequency of the Statistical Data – Definition, Types | How To Find Statistical Data Frequency with Examples?

In statistics and statistical data concepts, learning the basic knowledge about statistical variables, statistical range, and statistical data frequency is very important. In this article, we are going to deal with the Frequency of the Statistical Data like what is it, what are the types, how to calculate it, and some solved example problems on the frequency distribution in statistics. Just dive into this page and enhance your problem-solving & conceptual skills.

Check Related Topics:

What is Frequency in Statistics?

In statistics, the frequency (or absolute frequency) of an event ‘i’ is the number ni of times the observation occurred/recorded in an experiment or study. The frequency of the data is represented graphically in histograms.

An instance of the frequency distribution of alphabet letters in the English language is shown in the histogram below:

frequency distribution representation in histogram

Types of Statistical Data Frequency

Under Statistics, you will find four types of frequency distribution and they are as follows:

  1. Grouped Frequency
  2. Ungrouped Frequency
  3. Cumulative Frequency
  4. Relative Frequency

How to Find the Frequency?

The calculation of frequency can be done easily by following the steps given here. Simply find the frequency by dividing the number of repetitions of an event by the time it is needed for those repetitions to occur. Look at the steps:

  1. Learn the action
  2. Choose the length of time beyond which you will measure the frequency.
  3. Divide the number of times the event occurs by the length of time.

How to Calculate Frequency Statistics in Ungrouped Distribution?

The given steps should be followed by students to learn how to find frequency statistics in the case of an ungrouped frequency distribution.

Step 1: Finding the Range of Data Changes
Step 2: Finding the Frequencies

Here, first, we sort the given data in order from small to large and then calculate the frequency of each data.

Frequency of the Statistical Data Examples with Solutions

Example 1:
What is the frequency of 3 in the following data?
5, 6, 3, 3, 2, 4, 7, 5, 2, 3, 5, 6, 5, 4, 4, 3, 5, 2, 5, 3.
Solution:
Given data is 5, 6, 3, 3, 2, 4, 7, 5, 2, 3, 5, 6, 5, 4, 4, 3, 5, 2, 5, 3.
To find the frequency of 3, look at the given data and find out how many times it appears.
Here, 3 appears 5 times in the collection.
Hence, the frequency of 3 is 5.

Example 2:
The weights (in kg) of the 15 students of a class are recorded as 60, 65, 63, 70, 65, 62, 65, 63, 64, 60, 68, 58, 62, 64, 65. What is the value of the variable whose frequency is 4?
Solution:
Given weights (in kg) of the 15 students of a class is 60, 65, 63, 70, 65, 62, 65, 63, 64, 60, 68, 58, 62, 64, 65
From the data, 65 is the value of the variable whose frequency is 4.

FAQs on Frequency Distribution of the Statistical Data

1. What are the basic steps to find the frequency statistics in Grouped Distribution?

The basic steps for calculating the frequency statistics in Grouped Distribution are as follows:

Step 1: Obtaining the Range of Data Changes
Step 2: Finding the Range Changes within Each Group
Step 3: Creating the Groups
Step 4: Calculating the Frequencies

2. What is the formula for Relative Frequency? 

The formula to find the relative frequency is the ratio (fraction or proportion) of the number of times a value of the data occurs in the set of all outcomes to the total number of outcomes. ie.,

Relative frequency = \(\frac { frequency of the class }{ total } \)

3. How do you calculate the Cumulative relative frequency?

To calculate the cumulative relative frequency, we have to do a summation of all previous relative frequencies to the relative frequency for the current row ie.,

Cumulative relative frequency = sum of previous relative frequencies + current class frequency 

Problems on Comparison Between Rational Numbers

Problems on Comparison Between Rational Numbers | Comparing Rational Numbers Question and Answers

Rational Numbers can be expressed in the form of fractions. In this article, we will solve different types of problems on basis of comparison between rational numbers. Learn the different methods for solving problems on comparing rational numbers. Comparing the Fractions depends on the kind of fraction we have to compare such as like and unlike fractions.

How to Compare Two Rational Numbers?

Follow the simple steps listed below to compare rational numbers. There are 2 scenarios in general while comparing between rational numbers. They are as such

Like Fractions: These are the fractions that have the same denominator. As the fractions have the same denominator we need to simply check the numerator and the one having a larger numerator is the greater of the two fractions.

Unlike Fractions: The fractions having different denominators are called Unlike Fractions. Firstly, we need to make the denominators equal in unlike fractions and the rest of the process is the same as like fractions.

Also, See:

Comparison of Rational Numbers Examples

Example 1.
Compare Rational Numbers 3/5 and 8/5?
Solution:
Given Rational Numbers are 3/5 and 8/5
The above fractions are like fractions so we need to check the numerators and the one which is having a larger numerator is the greater fraction.
8>3
Therefore, 8/5 is the greater rational number.

Example 2.
Compare the Rational Numbers 4/7 and 6/4?
Solution:
Given Rational Numbers are 4/7 and 6/4
the above fractions are unlike fractions. So we need to make the denominators the same i.e. by using the LCM Method.
LCM(7, 4) = 28
4/7 = 4*4/7*4 = 16/28
6/4 = 6*7/4*7 = 42/28
Now, since the denominators are equal we will continue the process the same as like fractions. Compare the numerators of the fractions i.e. 42>16
Therefore, 6/4 is greater than 4/7

Example 3.
Compare 4/6 and 2/6?
Solution:
Given Rational Numbers are 4/6 and 2/6
The above fractions are like fractions so we need to check the numerators and the one which is having a larger numerator is the greater fraction.
4>2
Therefore, 4/6 is the greater rational number.

Example 4.
Compare and arrange the following fractions into ascending order 3/5, 4/15, 7/9, 12/10?
Solution:
Given Rational Numbers are 3/5, 4/15, 7/9, 12/10
Since the fractions given are unlike fractions we need to first make the denominators the same. To do so we will take the LCM of Denominators and then equate them.
LCM(5, 15, 9, 10) = 90
3/5 = 3*14/5*14 = 42/90
4/15 = 4*6/15*6 = 24/90
7/9 = 7*10/9*10 = 70/90
12/10 = 12*9/10*9 = 108/90
Since the denominators are the same let us check the numerators and the one having the larger numerator is the larger fraction.
Since 24<42<70<108
4/15<3/5<7/9<12/10
Therefore, 4/15<3/5<7/9<12/10 is the ascending order of given fractions.

Example 5.
Compare and arrange the following in descending order 2/3, 4/15, 5/7, and 7/12?
Solution:
Given Rational Numbers are 2/3, 4/15, 5/7, and 7/12
Since the fractions given are unlike we need to make the denominators the same. Find the LCM of the denominators and then equate them
LCM(3, 15, 7,12) = 420
2/3 = 2*140/3*140 = 280/420
4/15 = 4*28/15*28 = 112/420
5/7 = 5*60/7*60 = 300/420
7/12 = 7*35/12*35 = 245/420
Since the denominators are the same we will check the numerators and then decide which fraction is larger
300>280>245>112
5/7>2/3>7/12>4/15
Therefore, 5/7>2/3>7/12>4/15 is the descending order of given fractions.

Worksheet on Mean of Ungrouped Data

Worksheet on Mean of Ungrouped Data | Activity Sheet on Finding Mean Practice Problems and Solutions PDF

Mean is the most commonly used central tendency measure. In Mathematics, there are various types of means but in Statistics, the mean is the sum of observations divided by the total number of observations. Also, there are other names for mean like arithmetic mean, average. Practicing Mean of Raw Data word problems can make you solve any kind of questions in exams easily. So, Answer all the questions provided in this Worksheet on Mean of Ungrouped Data PDF and gain extra knowledge on finding the arithmetic mean.

Also Check:

Practice Question on Mean for Ungrouped Data Worksheet PDF

Example 1:

The heights of five students are 155 in, 140 in, 150 in, 160 in, and,165 in respectively. Find the mean height of the students.

Solution:

Given heights of 5 students are 155 in, 140 in, 150 in, 160 in, and,165 in
Sum of the heights of five students = (155+140+150+160+165) = 770
Using Mean Formula,
Mean = {Sum of Observation} ÷ {Total numbers of Observations}
= 770 ÷ 5
= 154 in


Example 2:

Find the mean of the following.
(i) The first five positive integers.
(ii) 4, 11, 3, 5, 10, 15, 40

Solution:

(i) The first five positive numbers are 1, 2, 3, 4, 5
Mean of the five positive numbers = Sum of five positive numbers ÷ Total number
= 1+2+3+4+5 ÷ 5
= 15 ÷ 5
= 3
Hence, the mean of the first five positive numbers is 3.
(ii) Given list of observations are 4, 11, 3, 5, 10, 15, 40
To find the mean, use the mean formula and apply the given observations;
Mean = Sum of Observations ÷ Number of Observations
= 4+11+3+5+10+15+40 ÷ 7
= 88 ÷ 7
= 12.57(approx)


Example 3:

In the annual board exams in mathematics, 5 students scored 80 marks, 8 students scored 75 marks, 10 students scored 65 marks and 2 students scored 55 marks. Find the mean of their score.

Solution:

Given that,
Number of students scored 80 marks  =  5
Number of students scored 75 marks  =  8
Number of students scored 65 marks  =  10
Number of students scored 55 marks  =  2
Mean = [5(80) + 8(75) + 10(65) + 2(55)] / (5 + 8 + 10 + 2)
= 1760 / 25
= 70.4


Example 4:

The mean weight of five complete computer stations is 167.2 pounds. The weights of four of the computer stations are 158.4 pounds, 162.8 pounds, 165 pounds, and 178.2 pounds respectively. What is the weight of the fifth computer station?

Solution:

Given Mean weight of five computer stations = 167.2 pounds
To find the weight of the fifth computer station, use the mean formula
Let the fifth weight of computer stations be x.
Mean = Sum of weights / Number of weights
167.2 = 158.4+162.8+165+178.2+x / 5
167.2*5 = 664.4 + x
664.4 + x = 836
x = 836 – 664.4
x = 171.6 pounds
Hence, the weight of the fifth computer station is 171.6 pounds.


Example 5:

The mean height of 4 members of a family is 5.5. Three of them have heights of 5.6, 6.0, and 5.2. Find the height of the fourth member.

Solution:

Given heights of family members are 5.6, 6.0, 5.2
Mean height of 4 members of a family = 5.5
Let the fourth member height would be x
To find the fourth height x, apply the mean formula
Mean = sum of observations / number of observations
5.5 = 5.6+6.0+5.2+x / 4
5.5 * 4 = 16.8+x
16.8 + x = 22
x = 22-16.8
x = 5.2
Hence, the height of the fourth member is 5.2


Example 6:

The following data represent the number of pop-up advertisements received by 8 families during the past month. Determine the mean number of advertisements received by each family during the month.
20 25 30 25 40 45 50 55

Solution:

Given data is 20 25 30 25 40 45 50 55
Mean = Sum of data / Total number of data
= 20+25+30+35+40+45+50+55 / 8
= 300/8
= 37.5


Example 7: 

In a week, the temperature of a certain place is measured during winter are as follows 24ºC, 28ºC, 22ºC, 18ºC, 30ºC, 26ºC, 22ºC. Find the mean temperature of the week.

Solution:

Given temperatures are 24ºC, 28ºC, 22ºC, 18ºC, 30ºC, 26ºC, 22ºC
Mean temperature = Sum of all temperature / Number of terms
= 24ºC+28ºC+22ºC+18ºC+30ºC+26ºC+22ºC / 7
= 170 / 7
= 24.28 (approx)