Diameter, Radius, and Circumference are related to the circle. Let us discuss the relation between diameter radius and circumference of the circle in detail from this page. So, we suggest the students check out the complete article and know the relationship along with the examples. The use of the examples related to the Relation between Diameter Radius and Circumference is that you can know how to solve the problems in different ways using the formulas.
Relation between Diameter Radius and Circumference
The relationship between diameter radius and circumference is that diameter is double the radius and the circumference is slightly more than three times its diameter.
D = 2r
where,
D = diameter of a circle
r = radius of the circle
Formulas on Circle
- Diameter = 2 × radius
- Radius = diameter/2
- Circumference for given radius = πd
- Circumference for given diameter = 2πr
Also, Refer:
Examples on Relationship between Diameter Radius and Circumference
Example 1.
Find the diameter of a circle whose radius is 2.4 cm?
Solution:
Given that
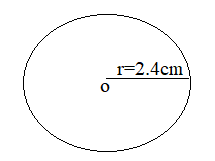
Radius = 2.4 cm
We know that,
Diameter = 2 × radius.
= 2 x 2.4 cm.
4.8 cm.
Therefore, the diameter of the circle = 4.8 cm.
Example 2.
Find the radius of a circle whose diameter is 24 cm.
Solution:
We know that
Radius = Diameter/2
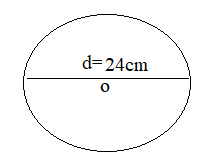
Diameter = 24 cm.
= 24/2 cm.
= 12 cm.
Therefore, the radius of the circle = 12 cm.
Example 3.
What is the circumference of a circle of diameter 20 cm?
Solution:
Given that
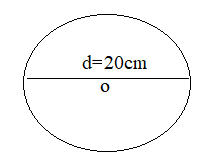
Diameter = 20 cm
We know that
Radius = d/2 = 20/2 = 10
Circumference = 2πr
= 2 × 3.14 × 10
= 62.8
Hence the circumference of the circle is 62.8 cm.
Example 4.
Find the circumference of a circle of radius is 6 cm
Solution:
Given that
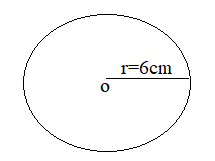
Radius = 6 cm
We know that
Circumference = πd
= 3.14 × 6
= 18.84
Thus the circumference of the circle is 18.84 cm.
Example 5.
What is the circumference of a circle of diameter 34 cm?
Solution:
Given that
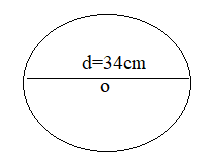
Diameter = 34 cm
We know that
Radius = d/2 = 34/2 = 17
Circumference = 2πr
= 2 × 3.14 × 17
= 106.76
Thus the circumference of the circle is 34 cm.
FAQs on How is Diameter Related to Radius and Circumference
1. How is diameter related to circumference?
The circumference of a circle is related to its diameter. C=πd So, when the circumference C is placed in a ratio with the diameter d.
2. What is the difference between circumference and radius?
The radius of a circle represented by r is the distance from the center of the circle to the outer edge, and the circumference of a circle is the perimeter of the circle that means a measure of the outer round length of the circle.
3. Is a circle a circumference?
In geometry, the circumference is the perimeter of a circle or ellipse.