Who doesn’t love the best learning? HMH Grade 8 Go Math Answer Key Chapter 3 Proportional Relationships is the perfect guide for students who love maths. Pupils can habituate practice maths if they start their practice with Go Math 8th Grade Chapter 3 Proportional Relationships Solution Key. The Go Math Grade 8 Answer Key includes an explanation for all the questions where students can easily understand the methods in an easy manner.
Go Math Grade 8 Chapter 3 Proportional Relationships Answer Key
Go Math Grade 8 Answer Key Chapter 3 Proportional Relationships offers the best way to practice math with simple techniques. The students can download and practice the questions from Go Math Grade 8 Text Book for free. The HMH Go Math Grade 8 Answer Key is provided will help the students to score the highest marks in the exams.
Lesson 1: Representing Proportional Relationships
- · Representing Proportional Relationships – Page No. 74
- · Representing Proportional Relationships – Page No. 75
- · Representing Proportional Relationships Lesson Check – Page No. 76
Lesson 2: Rate of Change and Slope
- · Rate of Change and Slope – Page No. 80
- · Rate of Change and Slope – Page No. 81
- · Rate of Change and Slope Lesson Check – Page No. 82
Lesson 3: Interpreting the Unit As Slope
- · Interpreting the Unit As Slope – Page No. 86
- · Interpreting the Unit As Slope – Page No. 87
- · Interpreting the Unit As Slope Lesson Check – Page No. 88
Lesson 4: Representing Proportional Relationships – Model Quiz
Mixed Review
Guided Practice – Representing Proportional Relationships – Page No. 74
Question 1.
Vocabulary
A proportional relationship is a relationship between two quantities in which the ratio of one quantity to the other quantity is/is not constant.
______ constant
Answer:
is constant
Explanation:
The rent would be proportional so therefore it is.
Question 2.
Vocabulary
When writing an equation of a proportional relationship in the form y = kx, k represents the __________________________.
______________
Answer:
constant of proportionality
Explanation:
When writing an equation of a proportional relationship in the form y = kx, k represents the constant of proportionality.
Question 3.
Write an equation that describes the proportional relationship between the number of days and the number of weeks in a given length of time.
a. Complete the table.

Type below:
______________
Answer:

Question 3.
b. Let x represent _____.
Let y represent _____.
The equation that describes the relationship is _____.
Type below:
______________
Answer:
Let x represent the time in weeks.
Let y represent the time in days.
The equation that describes the relationship is y = 7x.
Each table or graph represents a proportional relationship. Write an equation that describes the relationship.
Question 4.
Physical Science
The relationship between the numbers of oxygen atoms and hydrogen atoms in water.

Type below:
______________
Answer:
y = 2x

Explanation:
x represents the Oxygen atoms
y represents the Hydrogen atoms
For every point of the x-axis, the y-axis is varying with 2x times.
y = 2x
Question 5.
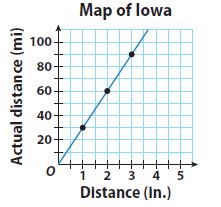
Type below:
______________
Answer:
y = 30x
Explanation:
x represents the Distance in inches
y represents the Actual Distance in miles
For every point of the x-axis, the y-axis is varying with 30x times.
y = 30x
Essential Question Check-In
Question 6.
If you know the equation of a proportional relationship, how can you draw the graph of the equation?
Type below:
______________
Answer:
Use the equation to make a table with x-values and y-values. Then graph the points (x, y) and draw a line through the points.
Independent Practice – Representing Proportional Relationships – Page No. 75
The table shows the relationship between temperatures measured on the Celsius and Fahrenheit scales.

Question 7.
Is the relationship between the temperature scales proportional? Why or why not?
______________
Answer:
No. The ratios of the numbers in each column are not equal.
Explanation:
Fahrenheit Temperature/Celsius Temperature = 50/10 = 5
86/30 = 2.87
122/50 = 2.44
The relationship is not propotional as the ratio is not constant.
Question 8.
Describe the graph of the Celsius-Fahrenheit relationship.
Type below:
______________
Answer:
A line starting at (0, 32) and slanting upward to the right.
Explanation:
The graph is a straight line with a y-intercept of 32.
Question 9.
Analyze Relationships
Ralph opened a savings account with a deposit of $100. Every month after that, he deposited $20 more.
a. Why is the relationship described not proportional?
Type below:
______________
Answer:
The account had a balance of $100, to begin with.
Question 9.
b. How could the situation be changed to make the situation proportional?
Type below:
______________
Answer:
Have Ralph open the account with no money, to begin with, and then put $20 every month.
Question 10.
Represent Real-World Problems
Describe a real-world situation that can be modeled by the equation y = \(\frac{1}{20}\)x. Be sure to describe what each variable represents.
Type below:
______________
Answer:
If x is the number of nickels you have, y = \(\frac{1}{20}\)x is the amount of money you have in dollars.
Look for a Pattern
The variables x and y are related proportionally.
Question 11.
When x = 8, y = 20. Find y when x = 42.
_______
Answer:
y = 105
Explanation:
x = 8, y = 20
y/x = 20/8
y = 20x/8
when x = 42
y = (20 × 42)/8
y = 105
Question 12.
When x = 12, y = 8. Find x when y = 12.
_______
Answer:
x = 18
Explanation:
x/y = 12/8
x = 12y/8
when y = 12
x = (12 × 12)/8
x = 18
Representing Proportional Relationships – Page No. 76
Question 13.
The graph shows the relationship between the distance that a snail crawls and the time that it crawls.
a. Use the points on the graph to make a table.

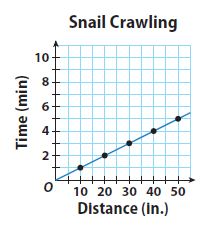
Type below:
______________
Answer:
![]()
Question 13.
b. Write the equation for the relationship and tell what each variable represents.
Type below:
______________
Answer:
y = 1/10 x, where y is the time in minutes and x is the distance in inches
Question 13.
c. How long does it take the snail to crawl 85 inches?
_______ minutes
Answer:
8.5 minutes
H.O.T.
Focus on Higher Order Thinking
Question 14.
Communicate Mathematical Ideas
Explain why all of the graphs in this lesson show the first quadrant but omit the other three quadrants.
Type below:
______________
Answer:
All of the graphs represent real-world data for which both x and y take on only nonnegative values, which graph in the first quadrant or on the axes. If either x or y or both could be negative, then other quadrants would be needed.
Question 15.
Analyze Relationships
Complete the table.

![]()
a. Are the length of a side of a square and the perimeter of the square related proportionally? Why or why not?
______________
Answer:
Yes. The ratio of the perimeter of a square to its side length is always 4.
Question 15.
b. Are the length of a side of a square and the area of the square related proportionally? Why or why not?
______________
Answer:
No. The ratio of the area of a square to its side length is not constant
Question 16.
Make a Conjecture
A table shows a proportional relationship where k is the constant of proportionality. The rows are then switched. How does the new constant of proportionality relate to the original one?
Type below:
______________
Answer:
It is the reciprocal of the original constant of proportionality
Guided Practice – Rate of Change and Slope – Page No. 80
Tell whether the rates of change are constant or variable.
Question 1.
building measurements _____

______________
Answer:
constant
Explanation:
Input variable: Feet
Output variable: Yard
For every point of the Yard, the Feet is increasing 3 times.
So, the answer is constant.
Question 2.
computers sold _____

______________
Answer:
variable
Explanation:
Identify the input and output variables
Input variable: Week
Output variable: The number sold
x-axis and y-axis points are not varying constantly. So, the answer is variable.
Question 3.
distance an object falls _____

______________
Answer:
variable
Explanation:
Identify the input and output variables
Input variable: Time
Output variable: Distance
x-axis and y-axis points are not varying constantly. So, the answer is variable.
Question 4.
cost of sweaters _____

______________
Answer:
constant
Explanation:
Identify the input and output variables
Input variable: Number
Output variable: Cost
x-axis and y-axis points are varying constantly. So, the answer is constant.
Erica walks to her friend Philip’s house. The graph shows Erica’s distance from home over time.
Question 5.
Find the rate of change from 1 minute to 2 minutes.
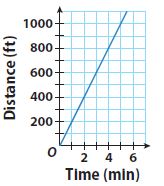
\(\frac{\text { change in distance }}{\text { change in time }}=\frac{400-?}{2-?}=\frac{?}{?}=?\) ft per min
________ feet per minute
Answer:
200 feet per minute
Explanation:
(400 – 200)/(2 – 1)
200/1
200 feet per minute
Question 6 (request help)
Find the rate of change from 1 minute to 4 minutes.
______ feet per minute
Answer:
200 ft per min
Explanation:
change in distance/change in time
(800 – 200)/(4 – 1)
600/3 = 200 ft per min
Find the slope of each line.
Question 7.
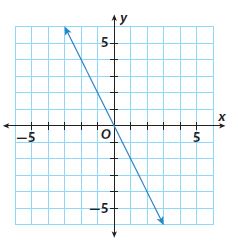
slope = _____
________
Answer:
slope = -2
Explanation:
From the given image, the x-axis is separated with 1 unit.
the y-axis is separated with 1 unit.
For every 1 unit of the x-axis, the slope is taken -2 units on the y-axis
The slope of the line is -2
Question 8.
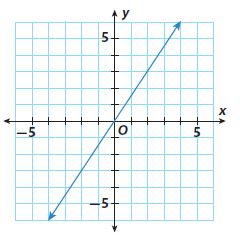
slope = _____
\(\frac{□}{□}\)
Answer:
\(\frac{3}{2}\)
Explanation:
From the given image, the slope is 3/2
Essential Question Check-In
Question 9.
If you know two points on a line, how can you find the rate of change of the variables being graphed?
Type below:
_____________
Answer:
Find the coordinates of two points on the line. Then divide the change in y-values from one point to the next by the change in x-values.
Independent Practice – Rate of Change and Slope – Page No. 81
Question 10.
Rectangle EFGH is graphed on a coordinate plane with vertices at E(-3, 5), F(6, 2), G(4, -4), and H(-5, -1).
a. Find the slopes of each side.
Type below:
_____________
Answer:
Slope EF = 1/3
slope FG = 3
slope GH = -1/3
slope HE =3
Question 10.
b. What do you notice about the slopes of opposite sides?
Type below:
_____________
Answer:
They are the same.
Question 10.
c. What do you notice about the slopes of adjacent sides?
Type below:
_____________
Answer:
They are negative reciprocals of one another.
Question 11.
A bicyclist started riding at 8:00 A.M. The diagram below shows the distance the bicyclist had traveled at different times. What was the bicyclist’s average rate of speed in miles per hour?

_______ miles per hour
Answer:
15 miles per hour
Explanation:
Total distance traveled by bicyclist = 4.5 mile + 7.5 mile = 12 mile
Total time taken by bicyclist = (8:48 A.M – 8:00 A.M) = 48 min = 0.8 hr
conversion used : ( 1 hour = 60 minute)
Average rate of speed = total distance/total time = 15 mile/hr
Question 12.
Multistep
A line passes through (6, 3), (8, 4), and (n, -2). Find the value of n.
_______
Answer:
n = -4
Explanation:
A line passes through (6, 3), (8, 4), and (n, -2).
From the given information, for every 2 points on x-axis, the y-values are changing one point.
(4, 2), (2, 1), (0, 0), (-2, -1), (-4, -2)
Question 13.
A large container holds 5 gallons of water. It begins leaking at a constant rate. After 10 minutes, the container has 3 gallons of water left.
a. At what rate is the water leaking?
_______ gallons per minute
Answer:
1 gallon every 5 minutes, or 0.2 gal/min
Explanation:
Rate = (5 – 3)/(0 – 10)
= 2/-10
= -0.2
The rate of water leaking is 1 gallon every 5 minutes, or 0.2 gal/min
Question 13.
b. After how many minutes will the container be empty?
_______ minutes
Answer:
25 minutes
Explanation:
Number of minutes = 5/0.2 = 25
It will take 25 minutes for the container to be empty.
Question 14.
Critique Reasoning
Billy found the slope of the line through the points (2, 5) and (-2, -5) using the equation \(\frac{2-(-2)}{5-(-5)}=\frac{2}{5}\). What mistake did he make?
Type below:
_____________
Answer:
He used the change in x over the change in y instead of the change in y over the change in x.
Rate of Change and Slope – Page No. 82
Question 15.
Multiple Representations
Graph parallelogram ABCD on a coordinate plane with vertices at A(3, 4), B(6, 1), C(0, -2), and D(-3, 1).
a. Find the slope of each side.
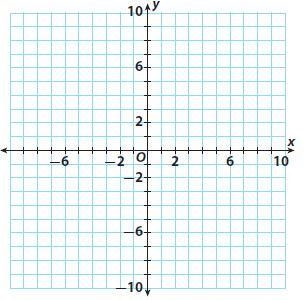
Type below:
_____________
Answer:
slope AB = -1;
slope BC = 1/2
slope CD = -1;
slope DA = 1/2
Explanation:
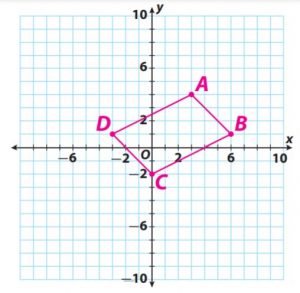
Question 15.
b. What do you notice about the slopes?
Type below:
_____________
Answer:
The slopes of the opposite sides are the same.
Question 15.
c. Draw another parallelogram on the coordinate plane. Do the slopes have the same characteristics?
Type below:
_____________
Answer:
Yes; opposite sides still have the same slope.
H.O.T.
Focus on Higher Order Thinking
Question 16.
Communicate Mathematical Ideas
Ben and Phoebe are finding the slope of a line. Ben chose two points on the line and used them to find the slope. Phoebe used two different points to find the slope. Did they get the same answer? Explain.
_____________
Answer:
Yes. The slope of a line is constant. Therefore, the slope that you calculate will be the same no matter which two points you choose.
Question 17.
Analyze Relationships
Two lines pass through the origin. The lines have slopes that are opposites. Compare and contrast the lines.
Type below:
_____________
Answer:
One line has a positive slope and one has a negative slope. The lines are equally steep, but one slants upward left to right while the other slants downward left to right. The lines cross at the origin.
Question 18.
Reason Abstractly
What is the slope of the x-axis? Explain.
_____________
Answer:
Zero. The rise along the x-axis is zero, while the run along the x-axis is not zero. The slope zero/run or zero.
Guided Practice – Interpreting the Unit As Slope – Page No. 86
Give the slope of the graph and the unit rate.
Question 1.
Jorge: 5 miles every 6 hours
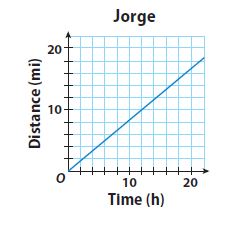
\(\frac{□}{□}\) miles per hour
Answer:
\(\frac{5}{6}\) miles per hour
Explanation:
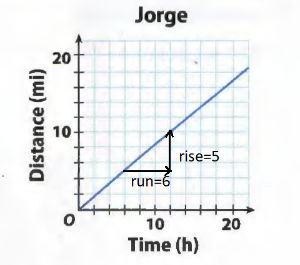
Slope = rise/run = 5/6
The unit rate a the distance traveled and the slope a the graph of the relationship is equal, 5/6 miles per hour
Calculate miles PER hour
5/6
Question 2.
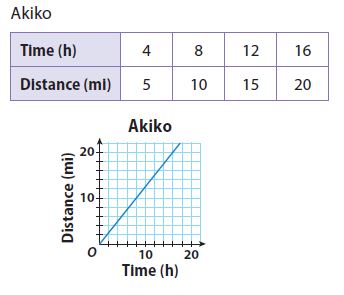
Akiko
\(\frac{□}{□}\) miles per hour
Answer:
\(\frac{5}{4}\) miles per hour
Explanation:
Calculate miles PER hour
5 miles/4hours = 5/4 miles per hour
Question 3.
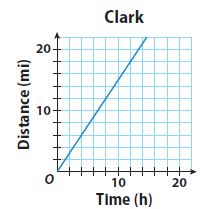
The equation y = 0.5x represents the distance Henry hikes, in miles, over time, in hours. The graph represents the rate that Clark hikes. Determine which hiker is faster. Explain.
___________
Answer:
Clark is faster.
Explanation:
From the equation, Henry’s rate is equal to 0.5, or 1/2 mile per hour. Clark’s rate is the slope of the line, which is 3/2 or 1.5 miles per hour.
Write an equation relating the variables in each table.
Question 4.

Type below:
___________
Answer:
y = 15x
Explanation:
y/x = 15/1
y = 15x
Multiply 15 with the x values to get the y values.
y = 15x
Question 5.

Type below:
___________
Answer:
y = 3/8 x
Explanation:
y/x = 6/16
y/x = 3/8
y = 3/8 x
Essential Question Check-In
Question 6.
Describe methods you can use to show a proportional relationship between two variables, x and y. For each method, explain how you can find the unit rate and the slope.
Type below:
___________
Answer:
The ratio of y to x gives the unit rate and slope.
Explanation:
If the equation can be written as y = mx, then m is the unit rate and the slope. Graph: When the line passes through the origin, then the value of r at the point (1, r) is the unit rate and the slope.
Independent Practice – Interpreting the Unit As Slope – Page No. 87
Question 7.
A Canadian goose migrated at a steady rate of 3 miles every 4 minutes.
a. Fill in the table to describe the relationship.

Type below:
___________
Answer:

Explanation:
Canadian goose migrated at a steady rate of 3 miles every 4 minutes
y/x = 3/4; x/y = 4/3
y = 3/4 x; x = 4/3 y
If x = 8, y = 3/4 × 8 = 6
If y = 9, x = 4/3 × 9 = 12
If y = 12, x = 4/3 × 12 = 16
If x = 20, y = 3/4 × 20 = 15
Question 7.
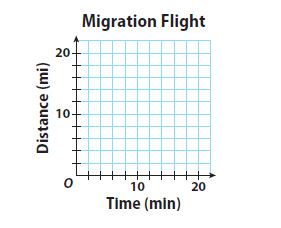
b. Graph the relationship.
Type below:
___________
Answer:
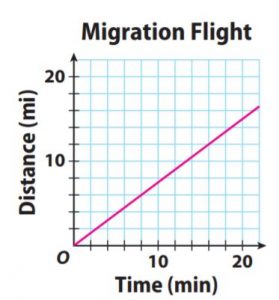
Explanation:
The points are (4, 3), (8, 6), (12, 9), (16, 12), (20, 15)
Question 7.
c. Find the slope of the graph and describe what it means in the context of this problem.
Slope: \(\frac{□}{□}\) miles per minute
Answer:
Slope: \(\frac{3}{4}\) miles per minute
Explanation:
The unit rate of migration of the goose and the slope of the graph both equal 3/4 mi/min
Question 8.
Vocabulary
A unit rate is a rate in which the first quantity / second quantity in the comparison is one unit.
___________
Answer:
second quantity
Explanation:
A unit rate is a rate in which the “second quantity” in the comparison is one unit
Question 9.
The table and the graph represent the rate at which two machines are bottling milk in gallons per second.
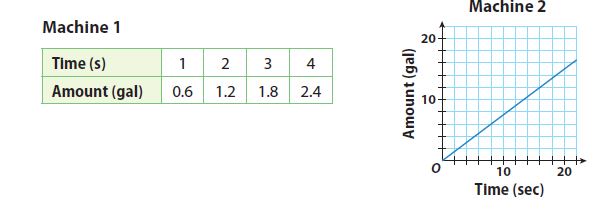
a. Determine the slope and unit rate of each machine.
Type below:
___________
Answer:
Machine 1: slope = unit rate = 0.6/1 = 0.6 gal/s
Machine 2: slope = unit rate = 3/4 = 0.75 gal/s
Question 9.
b. Determine which machine is working at a faster rate.
___________
Answer:
Machine 2 is working at a faster rate since 0.75 > 0.6
Interpreting the Unit As Slope – Page No. 88
Question 10.
Cycling
The equation y = \(\frac{1}{9}\) x represents the distance y, in kilometers, that Patrick traveled in x minutes while training for the cycling portion of a triathlon. The table shows the distance y Jennifer traveled in x minutes in her training. Who has the faster training rate?

___________
Answer:
Jennifer has a faster training rate
Explanation:
Patrick’s rate is 1/9 kilometer per minute. Jennifer’s rate is 1/8 kilometer per minute. 1/9 < 1/8. So, Jennifer has a faster training rate.
H.O.T.
Focus on Higher Order Thinking
Question 11.
Analyze Relationships
There is a proportional relationship between minutes and dollars per minute, shown on a graph of printing expenses. The graph passes through the point (1, 4.75). What is the slope of the graph? What is the unit rate? Explain.
______ dollars per minute
Answer:
$4.75/min
Explanation:
slope = unit rate = 4.75.
If the graph of a proportional relationship passes through the point (1, r), then r equals the slope and the unit rate, which is $4.75/min.
Question 12.
Draw Conclusions
Two cars start at the same time and travel at different constant rates. A graph for Car A passes through the point (0.5, 27.5), and a graph for Car B passes through (4, 240). Both graphs show distance in miles and time in hours. Which car is traveling faster? Explain.
___________
Answer:
Car B
Explanation:
The slope and unit rate of speed of Car A is (27.5 – 0)/(0.5 – 0) = 27.5/0.5 = 55 mi/h.
The slope and unit rate of speed of Car B is (240 – 0)/(4 – 0) = 240/4 = 60 mi/h.
60 > 55, so Car B is traveling faster.
Question 13.
Critical Thinking
The table shows the rate at which water is being pumped into a swimming pool. Use the unit rate and the amount of water pumped after 12 minutes to find how much water will have been pumped into the pool after 13 \(\frac{1}{2}\) minutes. Explain your reasoning.

______ gallons
Answer:
243 gallons
Explanation:
The unit rate is 36/2 = 18gal/min.
So, 1 1/2 minutes after 12 minutes, an additional 18 × 1 1/2 = = 27 gallons will be pumped in.
So, the total is 216 + 27 = 243 gal.
3.1 Representing Proportional Relationships – Model Quiz – Page No. 89
Question 1.
Find the constant of proportionality for the table of values.

______
Answer:
1.5
Explanation:
constant of proportionality
k = y/x = 3/2 = 1.5
k = y/x = 4.5/3 = 1.5
k = y/x = 6/4 = 1.5
k = y/x = 7.5/5 = 1.5
Question 2.
Phil is riding his bike. He rides 25 miles in 2 hours, 37.5 miles in 3 hours, and 50 miles in 4 hours. Find the constant of proportionality and write an equation to describe the situation.
Type below:
___________
Answer:
The constant of proportionality is 12.5 miles per hour.
Explanation:
The equation is d = 12.5 × t
25 miles ÷ 2 hours = 12.5 miles/hour
A direct proportionality d = 12.5 × t
3.2 Rate of Change and Slope
Find the slope of each line.
Question 3.
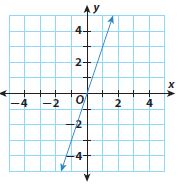
______
Answer:
Slope = 3
Question 4.
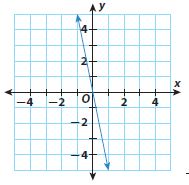
______
Answer:
Slope = -5
3.3 Interpreting the Unit Rate as Slope
Question 5.
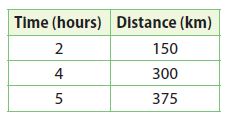
The distance Train A travels is represented by d = 70t, where d is the distance in kilometers and t is the time in hours. The distance Train B travels at various times is shown in the table. What is the unit rate of each train? Which train is going faster?
____________
Answer:
Train A: 70 km per hour; Train B: 75 km per hour; Train B is faster.
Explanation:
The distance Train A travels is represented by d = 70t
where d is the distance in kilometers and t is the time in hours
The speed of train A is 70 kilometer per hour
To find the speed of train B use the table
Slope = (300 – 150)/(4 – 2) = 75
The speed of train B is 75 km per hour
The speed of train B is more
Essential Question
Question 6.
What is the relationship among proportional relationships, lines, rates of change, and slope?
Type below:
____________
Answer:
The relationship between the x-axis and y-axis of any graph is a proportional Relationship which is defined by slope i.e. calculating the rate of change of the plotted line.
1) Here proportional change and rate of change are algebraic quantities which specify how one quantity changes with respect to another.
2) Line and Slope are geometric quantities which describe the graph of any equation.
Selected Response – Mixed Review – Page No. 90
Question 1.
Which of the following is equivalent to 5-1?
Options:
a. 4
b. \(\frac{1}{5}\)
c. −\(\frac{1}{5}\)
d. -5
Answer:
b. \(\frac{1}{5}\)
Explanation:
5-1
1/5
Question 2.
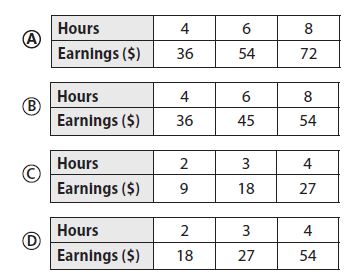
Prasert earns $9 an hour. Which table represents this proportional relationship?
Options:
a. A
b. B
c. C
d. D
Answer:
a. A
Explanation:
a. 36/4 = 9; 54/6 = 9; 72/8 = 9
b. 36/4 = 9; 45/6 = 7.5; 54/8 = 6.75
c. 9/2 = 4.5
d. 18/2 = 9; 27/3 = 9; 54/4 = 13.5
Question 3.
A factory produces widgets at a constant rate. After 4 hours, 3,120 widgets have been produced. At what rate are the widgets being produced?
Options:
a. 630 widgets per hour
b. 708 widgets per hour
c. 780 widgets per hour
d. 1,365 widgets per hour
Answer:
c. 780 widgets per hour
Explanation:
A factory produces widgets at a constant rate. After 4 hours, 3,120 widgets have been produced.
3,120/4 = 780 widgets per hour
Question 4.
A full lake begins dropping at a constant rate. After 4 weeks it has dropped 3 feet. What is the unit rate of change in the lake’s level compared to its full level?
Options:
a. 0.75 feet per week
b. 1.33 feet per week
c. -0.75 feet per week
d. -1.33 feet per week
Answer:
c. -0.75 feet per week
Explanation:
A full lake begins dropping at a constant rate. After 4 weeks it has dropped 3 feet.
(-3 ft)/(4 weeks) = -3/4 ft/wk = -0.75 ft/wk
Question 5.
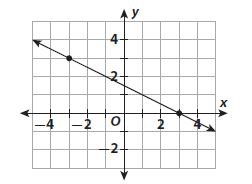
What is the slope of the line below?
Options:
a. -2
b. −\(\frac{1}{2}\)
c. \(\frac{1}{2}\)
d. 2
Answer:
c. \(\frac{1}{2}\)
Explanation:
(-1.5, 1.5) & (1.5, 0)
(0 – 1..5)/(1.5 – (-1.5))
1.5/3
= 1/2
Question 6.
Jim earns $41.25 in 5 hours. Susan earns $30.00 in 4 hours. Pierre’s hourly rate is less than Jim’s, but more than Susan’s. What is his hourly rate?
Options:
a. $6.50
b. $7.75
c. $7.35
d. $8.25
Answer:
b. $7.75
Explanation:
Jim earns $41.25 in 5 hours.
$41.25/5 = 8.25
Jim’s unit rate is $8.25 per hour
30/4 = 7.5
Pierre’s hourly rate is is less than $8.25 but more than $7.50
$7.75
Mini-Task
Question 7.
Joelle can read 3 pages in 4 minutes, 4.5 pages in 6 minutes, and 6 pages in 8 minutes.
a. Make a table of the data.

Type below:
______________
Answer:

Explanation:
Joelle can read 3 pages in 4 minutes,
y/x = 3/4
y = 3/4 x
If x = 6, y = 3/4 × 6 = 4.5
If x = 8, y = 3/4 × 8 = 6
Question 7.
b. Use the values in the table to find the unit rate.
_______ pages per minute
Answer:
0.75 pages per minute
Explanation:
3/4 = 0.75
4.5/6 = 0.75
6/8 = 0.75
The unit rate is 0.75 pages per minute
Question 7.
c. Graph the relationship between minutes and pages read.
Type below:
______________
Answer:
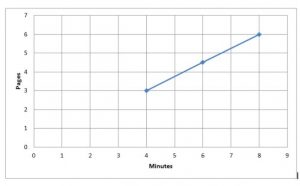
Conclusion:
I wish the info prevailed regarding the Go Math Grade 8 Answer Key Chapter 3 Proportional Relationships PDF is beneficial for you. Share this pdf with your besties in order to help them to overcome the difficulties in maths. Students can definitely score good marks in the exam with the help of the Go Math 8th Grade Ch 3 Proportional Relationships Solution Key.All the Best!!!
