Get free step by step explanations for all the questions in Go Math Grade 7 Answer Key Chapter 10 Random Samples and Populations. Make use of the links and start preparing for the exams through Go Math Grade 7 Answer Key for Chapter 10 Random Samples and Populations. It is very essential for the students to understand the concepts in Chapter 10 Random Samples and Populations.
Go Math Grade 7 Answer Key Chapter 10 Random Samples and Populations
Go Math Grade 7 Solution Key Chapter 10 Random Samples and Populations is the best study material to score the highest marks in the examinations. The HMH Go Math 7th Grade Answer Key Chapter 10 Random Samples & Populations helps the students to understand the concepts without any difficulty. Click on the below links for the Go Math Grade 7 solutions which are given with a brief explanation.
Chapter 10 Random Samples and Populations – Lesson 1
Chapter 10 Random Samples and Populations – Lesson: 2
Chapter 10 – Random Samples and Populations
- Page No. 326
- Page No. 327
- Page No. 328
- 10.1 Populations and Samples – Page No. 329
- Selected Response – Page No. 330
Guided Practice – Page No. 314
Question 1.
Follow each method described below to collect data to estimate the average shoe size of seventh grade boys.
Answer:
Method 1:
Select randomly 5 seventh grade boys and record their shoe size in a table.
Answer:
The mean is \(\frac{10+8+7.5+9+10}{5}
= \frac{44.5}{5}\)
= 8.9
Method 2:
Find the 5 boys in the class who has largest shoe size and record in a table.
Answer:
Question 2.
Method 1 produces results that are more/less representative of the entire student population because it is a random/biased sample.
Answer: Method 1 produces results that are more representative of the entire student population because it is a random sample.
Question 3.
Method 2 produces results that are more/less representative of the entire student population because it is a random/biased sample.
Answer: Method 2 produces results that are less representative of the entire student population because it is a biased sample.
Question 4.
Heidi decides to use a random sample to determine her classmates’ favorite color. She asks, “Is green your favorite color?” Is Heidi’s question biased? If so, give an example of an unbiased question that would serve Heidi better.
Answer: Heidi’s question is biased as it suggests that people should say their favorite color is green. “What was your favorite color?” is an unbiased question, as it doesn’t suggest a certain answer.
Essential Question Check-In
Question 5.
How can you select a sample so that the information gained represents the entire population?
Answer: We should select a sample that is randomly chosen and is sufficiently large enough so that the result so that results are representative of the entire population.
Independent Practice – Page No. 315
Question 6.
Paul and his friends average their test grades and find that the average is 95. The teacher announces that the average grade of all of her classes is 83. Why are the averages so different?
Answer: As Paul and his friends are not a randomly chosen sample of the class population, so the averages are different.
Question 7.
Nancy hears a report that the average price of gasoline is $2.82. She averages the prices of stations near her home. She finds the average price of gas to be $3.03. Why are the averages different?
Answer: The gas stations around Nancy home are not a randomly chosen sample of all gas stations in the country, so the averages are so different.
For 8–10, determine whether each sample is a random sample or a biased sample. Explain.
Question 8.
Carol wants to find out the favorite foods of students at her middle school. She asks the boys’ basketball team about their favorite foods.
Answer: As Carol asks only boys and girls are not represented in the sample, so the sample is biased.
Question 9.
Dallas wants to know what elective subjects the students at his school like best. He surveys students who are leaving band class.
Answer: Dallas asked only students who are in band class and elective subject students are not represented, so the sample is biased.
Question 10.
To choose a sample for a survey of seventh graders, the student council puts pieces of paper with the names of all the seventh graders in a bag, and selects 20 names.
Answer: As all students had an equal chance of being represented in the survey, so the sample is random.
Question 11.
Members of a polling organization survey 700 of the 7,453 registered voters in a town by randomly choosing names from a list of all registered voters. Is their sample likely to be representative?
Answer: The sample is large enough and randomly chosen from all registered voters so that every voter gets a chance of being selected.
So the sample is likely to be representative.
For 12–13, determine whether each question may be biased. Explain.
Question 12.
Joey wants to find out what sport seventh grade girls like most. He asks girls, “Is basketball your favorite sport?”
Answer: As it mentions basketball and suggesting that girls should give a certain answer. So the question is biased.
Question 13.
Jae wants to find out what type of art her fellow students enjoy most. She asks her classmates, “What is your favorite type of art?”
Answer: As it does not suggest students should give a certain answer, so it is not biased.
H.O.T. – Page No. 316
Focus on Higher Order Thinking
Question 14.
Draw Conclusions
Determine which sampling method will better represent the entire population. Justify your answer.
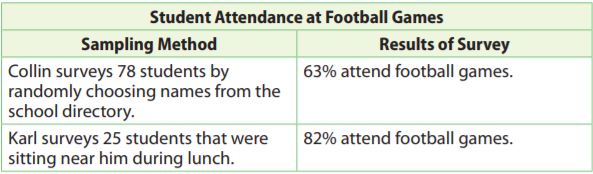
Answer: Collin’s survey is a better sampling method. Collin is randomly choosing names from the school directory, so each student has a chance of being chosen because they all appear in the school directory.
Karl’s survey is biased, as he is only choosing the students that were sitting near him during lunch which means the people he is asking are not representative of the entire population.
Question 15.
Multistep
Barbara surveyed students in her school by looking at an alphabetical list of the 600 student names, dividing them into groups of 10, and randomly choosing one from each group.
a. How many students did she survey? What type of sample is this?
__________ people
This is a __________ sample
Answer: Barbara made 600÷10= 60 groups, so she chosen one person in each group and surveyed 60 people. So this is a random sample because all the students are being represented and have an equal chance of being chosen.
Question 15.
b. Barbara found that 35 of the survey participants had pets. About what percent of the students she surveyed had pets? Is it safe to believe that about the same percent of students in the school have pets? Explain your thinking.
__________ %
Answer: As there are 60 survey participants and in that 35/60= 0.58% ≈58%. Yes, it is safe to believe that about the same percent of students in the school have pets because the sample is large enough large and all students have represented.
Question 16.
Communicating Mathematical Ideas
Carlo said a population can have more than one sample associated with it. Do you agree or disagree with his statement? Justify your answer.
Answer: Yes I agree. As there are many different ways to randomly select a sample. By using the same way of choosing a sample multiple times could create a different sample. For example, picking name out of a hat will not give you the same sample every time since the names will get mixed up every time you go to pick a name.
Guided Practice – Page No. 320
Patrons in the children’s section of a local branch library were randomly selected and asked their ages. The librarian wants to use the data to inferthe ages of all patrons of the children’s section so he can select age appropriate activities. In 3–6, complete each inference.
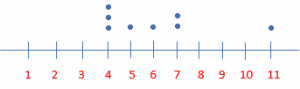
7, 4, 7, 5, 4, 10, 11, 6, 7, 4
Question 1.
Make a dot plot of the sample population data.
Answer:
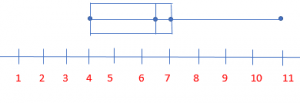
Question 2.
Make a box plot of the sample population data.
Answer: First we need to find the median, so we need to order the numbers from least to greatest: 4,4,4,5,6,7,7,7,10,11.
So median is (6+7)/2= 13/2= 6.5.
And the median for half of the data is 4,4,4,5,6= 4.
And the other half of the data is 7,7,7,10,11= 7.
Question 3.
The most common ages of children that use the library are _____ and _____.
_____ and _____
Answer: 4 and 7 are the numbers repeated the most in the data set, so the most common ages of the children that use the library are 4 and 7.
Question 4.
The range of ages of children that use the library is from _____ to _____.
_____ to _____
Answer: The lower that appears in the data set is 4 and the higher that appears in the data set is 11, so the range of ages of children that use the library is from 4 to 7.
Question 5.
The median age of children that use the library is _____.
_____
Answer: The median age of children that use the library is 6.5.
Question 6.
A manufacturer fills an order for 4,200 smart phones. The quality inspector selects a random sample of 60 phones and finds that 4 are defective. How many smart phones in the order are likely to be defective?
About _____ smart phones in the order are likely to be defective.
_____ smartphones
Answer: If we breakdown the whole order into samples of 60 phones we will get 4200÷60= 70 samples. So if we find 4 defective smartphones in every sample and we can expect about 4×70= 280 smartphones in the order are likely to be defective.
Question 7.
Part of the population of 4,500 elk at a wildlife preserve is infected with a parasite. A random sample of 50 elk shows that 8 of them are infected. How many elk are likely to be infected?
_____ elk
Answer: If we break down the whole elk population into samples of 50 elk, we get 4500÷50= 90 samples. So if we find 8 infected elk in every sample and we can expect about 8×90= 720 elk to be infected.
Essential Question Check-In
Question 8.
How can you use a random sample of a population to make predictions?
Answer: We can use a random sample of a population to make predictions by setting the ratio for the sample equal to the ratio for the population.
Independent Practice – Page No. 321
Question 9.
A manager samples the receipts of every fifth person who goes through the line. Out of 50 people, 4 had a mispriced item. If 600 people go to this store each day, how many people would you expect to have a mispriced item?
_____ people
Answer: 48 people.
Explanation:
Let X be the number of people with a mispriced item, so
4/50= X/600
50X= 2400
X= 48.
So there will be 48 people with a mispriced item.
Question 10.
Jerry randomly selects 20 boxes of crayons from the shelf and finds 2 boxes with at least one broken crayon. If the shelf holds 130 boxes, how many would you expect to have at least one broken crayon?
_____ boxes
Answer: 13 boxes.
Explanation:
Let X be the number of boxes with at least one broken crayon
2/20= X/130
20X= 260
X= 13.
So there will be 13 boxes with at least one broken crayon.
Question 11.
A random sample of dogs at different animal shelters in a city shows that 12 of the 60 dogs are puppies. The city’s animal shelters collectively house 1,200 dogs each year. About how many dogs in all of the city’s animal shelters are puppies?
_____ dogs
Answer: 240 dogs.
Explanation:
Let X be the number of boxes with at least one broken crayon
12/60= X/1200
60X= 14400
X= 240.
So there will be 240 dogs in all of the city’s animal shelters are puppies.
Question 12.
Part of the population of 10,800 hawks at a national park are building a nest. A random sample of 72 hawks shows that 12 of them are building a nest. Estimate the number of hawks building a nest in the population.
_____ hawks
Answer: 1800 hawks.
Explanation:
Let X be the number of boxes with at least one broken crayon
12/72= X/10,800
72X= 10,800
X= 1800.
So there will be 1800 number of hawks building a nest in the population.
Question 13.
In a wildlife preserve, a random sample of the population of 150 raccoons was caught and weighed. The results, given in pounds, were 17, 19, 20, 21, 23, 27, 28, 28, 28 and 32. Jean made the qualitative statement, “The average weight of the raccoon population is 25 pounds.” Is her statement reasonable? Explain.
_____
Answer: Yes, Jean’s statement is reasonable.
Explanation: As the weights are not given for all 150 raccoons, so we don’t know how many raccoons at each of the weights given and we cannot calculate the average. So the best way to estimate the average is to find the median of the data set. So the median is
(23+27)/2= 25. As the median is 25 Jean’s statement is reasonable.
Question 14.
Greta collects the number of miles run each week from a random sample of female marathon runners. Her data are shown below. She made the qualitative statement, “25% of female marathoners run 13 or more miles a week.” Is her statement reasonable? Explain. Data: 13, 14, 18, 13, 12, 17, 15, 12, 13, 19, 11, 14, 14, 18, 22, 12.
_____
Answer: Greta’s statement is not reasonable.
Explanation: If we set the data from least to highest then 11,12,12,12,13,13,13,14,14,14,15,17,18,18,19,22. So there are 16 marathon runners, 12 of them run 13 miles or more each week. So
12/16= 0.75= 75%. So Greta’s statement is not reasonable.
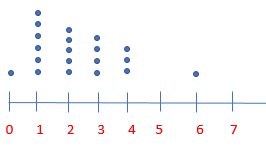
Question 15.
A random sample of 20 of the 200 students at Garland Elementary is asked how many siblings each has. The data are ordered as shown. Make a dot plot of the data. Then make a qualitative statement about the population. Data: 0, 1, 1, 1, 1, 1, 1, 2, 2, 2, 2, 2, 3, 3, 3, 3, 4, 4, 4, 6.
Answer: The mean is 2.
Explanation:
The mean is \(\frac{0+1+1+1+1+1+1+2+2+2+2+2+3+3+3+3+4+4+4+6}{20}
= \frac{46}{20}\)
= 2.3
So the mean is 2 as for the siblings the number must be whole number.
Most of the students have at least 1 sibling and most of the students have fewer than 6 siblings, and the students have an average of two siblings.
Question 16.
Linda collects a random sample of 12 of the 98 Wilderness Club members’ ages. She makes an inference that most wilderness club members are between 20 and 40 years old. Describe what a box plot that would confirm Linda’s inference should look like.
Answer: Linda will conclude that most of the club members are between the ages of 20 and 40, so more than half of the 12 surveyed members must be between those ages. The box plot would have the lower quartile at 20 and upper quartile at 40.
Page No. 322
Question 17.
What’s the Error?
Kudrey was making a box plot. He first plotted the least and greatest data values. He then divided the distance into half, and then did this again for each half. What did Kudrey do wrong and what did his box plot look like?
Answer: By creating a box plot, the 3 middle values are not found by dividing the distance between the maximum and minimum values and then dividing the distances in half again. The 3 middle values are found by finding the median of the set values, the median of the first half of the values, and the median of the last half of the values.
H.O.T.
Focus on Higher Order Thinking
Question 18.
Communicating Mathematical Ideas
A dot plot includes all of the actual data values. Does a box plot include any of the actual data values?
______
Answer: Yes, a dot plot will include all of the actual data values. The only actual data values that a box plot must have the minimum and maximum values. The 3 median values may are may not be actual data values.
Question 19.
Make a Conjecture
Sammy counted the peanuts in several packages of roasted peanuts. He found that the bags had 102, 114, 97, 85, 106, 120, 107, and 111 peanuts. Should he make a box plot or dot plot to represent the data? Explain your reasoning.
______
Answer: Sammy should make a box plot to represent the data. As dot plots are helpful in finding the number of times each value occurs in a data set. As the values occur only once, so the box plot will better represent the data.
Question 20.
Represent Real-World Problems
The salaries for the eight employees at a small company are $20,000, $20,000, $22,000, $24,000, $24,000, $29,000, $34,000 and $79,000. Make a qualitative inference about a typical salary at this company. Would an advertisement that stated that the average salary earned at the company is $31,500 be misleading? Explain.
______
Answer: Yes, the statement is misleading.
Explanation: The median of the data set is \(\frac{$24,000+$24,000}{2}
= \frac48,000}{2}\)
= 24,000.
Yes, the statement is misleading because $31,500 is higher than 6 of the 8 salaries at the company.
Page No. 326
A manufacturer gets a shipment of 600 batteries of which 50 are defective. The store manager wants to be able to test random samples in future shipments. She tests a random sample of 20 batteries in this shipment to see whether a sample of that size produces a reasonable inference about the entire shipment.
Question 1.
The manager selects a random sample using the formula randInt( , ) to generate _____ random numbers.
Answer: Since 50 out of 600 batteries are defective and she is testing 20 batteries she can use randInt(1,600) to generate 20 random numbers.
Question 2.
She lets numbers from 1 to _____ represent defective batteries, and _____ to _____ represent working batteries. She generates this list: 120, 413, 472, 564, 38, 266, 344, 476, 486, 177, 26, 331, 358, 131, 352, 227, 31, 253, 31, 277.
Answer: She lets numbers from 1 to 50 represent defective batteries and 51 to 600 represent working batteries. She generates this list:
120, 413, 472, 564, 38, 266, 344, 476, 486, 177, 26, 331, 358, 131, 352, 227, 31, 253, 31, 277.
Question 3.
Does the sample produce a reasonable inference?
______
Answer: No, the sample does not produce a reasonable inference. In sample 26, 31,31,38 numbers represent defective batteries, and in shipment 50 out of 600 of the batteries are defective.
Essential Question Check-In
Question 4.
What can happen if a sample is too small or is not random?
Answer: If the sample is too small or not random, it is likely to produce unrepresentative data values.
Page No. 327
Maureen owns three bagel shops. Each shop sells 500 bagels per day. Maureen asks her store managers to use a random sample to see how many whole-wheat bagels are sold at each store each day. The results are shown in the table. Use the table for 5–7.
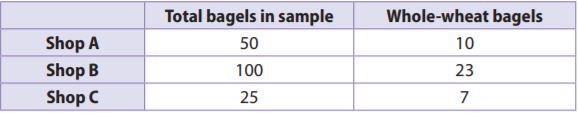
Question 5.
If you assume the samples are representative, how many whole-wheat bagels might you infer are sold at each store?
Shop A: ___________
Shop B: ___________
Shop C: ___________
Answer:
Shop A: 100.
Shop B: 115.
Shop C: 140.
Explanation:
Shop A:
10/50×500
= 10×10
= 100.
Shop B:
23/100×500
= 23×5
= 115.
Shop C:
7/25×500
= 7×20
= 140.
Question 6.
Rank the samples for the shops in terms of how representative they are likely to be. Explain your rankings.
Answer: The samples can be ranked as C, A, B from least to most. Shop B’s is the most representative because it contained the most bagel. Shop C’s is the least representative because it contained the fewest bagels.
Question 7.
Which sample or samples should Maureen use to tell her managers how many whole-wheat bagels to make each day? Explain.
Answer: Maureen should use either Shop A or Shop B because the use a sufficient number of bagels to be considered accurate. Shop C’s sample would be the least representative because it contained the fewest bagels.
Question 8.
In a shipment of 1,000 T-shirts, 75 do not meet quality standards. The table below simulates a manager’s random sample of 20 T-shirts to inspect. For the simulation, the integers 1 to 75 represent the below-standard shirts.
Answer: In the sample, two values are from 1 to 75. So, 2 shirts are below the quality standards. So
= 2/20×1000
= 2×50
= 100.
The prediction would be that 100 shirts are below quality standards, which would be 25 more than the actual number.
Page No. 328
Question 9.
Multistep
A 64-acre coconut farm is arranged in an 8-by-8 array. Mika wants to know the average number of coconut palms on each acre. Each cell in the table represents an acre of land. The number in each cell tells how many coconut palms grow on that particular acre.
a. The numbers in green represent Mika’s random sample of 10 acres. What is the average number of coconut palms on the randomly selected acres?
______
Answer: The average is 49.8 coconut palms.
Explanation: The average is \(\frac{56+43+62+63+33+34+38+51+59+59}{10}
= \frac{498}{10}\)
= 49.8
Question 9.
b. Project the number of palms on the entire farm.
______
Answer: 3187 palms.
Explanation: As the average is 49.8 for each acre, so for 64 acres it is 64×49.8= 3187.2. So the number of palms on the entire farm is 3187.
H.O.T.
Focus on Higher Order Thinking
Question 10.
Draw Conclusions
A random sample of 15 of the 78 competitors at a middle school gymnastics competition are asked their height. The data set lists the heights in inches: 55, 57, 57, 58, 59, 59, 59, 59, 59, 61, 62, 62, 63, 64, 66. What is the mean height of the sample? Do you think this is a reasonable prediction of the mean height of all competitors? Explain.
Answer: Yes, this is a reasonable prediction.
Explanation: The mean height is \(\frac{55+57+57+58+59+59+59+59+59+61+62+62+63+64+66}{15}
= \frac{900}{15}\)
= 60 inches.
Yes, this is a reasonable prediction of the mean height of all competitors because it is a good sample generated randomly and contains sufficient values. So it should provide a good estimate of the mean height of all competitors.
Question 11.
Critical Thinking
The six-by-six grid contains the ages of actors in a youth Shakespeare festival. Describe a method for randomly selecting 8 cells by using number cubes. Then calculate the average of the 8 values you found.
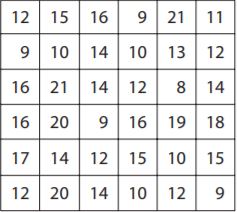
Answer: The average is 15.
Explanation: We can roll a number cube twice and record each value. The first value will be the row number and the second will be the column number we repeat the process 8 times in order to get 8 ages from the grid. 12,10,21,9,18,16,14,20.
The mean is \(\frac{12+10+21+9+18+16+14+20}{6}
= \frac{120}{8}\)
= 15
Question 12.
Communicating Mathematical Ideas
Describe how the size of a random sample affects how well it represents a population as a whole.
Answer: The bigger the size of the random sample, the more likely it so accurately represents the population.
10.1 Populations and Samples – Page No. 329
Question 1.
A company uses a computer to identify their 600 most loyal customers from its database and then surveys those customers to find out how they like their service. Identify the population and determine whether the sample is random or biased.
The sample is _______
Answer: The population is the customers in the company’s database. The sample is biased because instead of surveying all of their customers, the company only surveyed their most loyal customers.
10.2 Making Inferences from a Random Sample
Question 2.
A university has 30,330 students. In a random sample of 270 students, 18 speak three or more languages. Predict the number of students at the university who speak three or more languages.
_______ students
Answer: 2022 students.
Explanation: Let X be the number of students to speak three or more languages, so
18/270 = X/30,330
1/15 = X/30,330
X= 2022.
10.3 Generating Random Samples
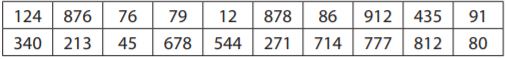
A store receives a shipment of 5,000 MP3 players. In a previous shipment of 5,000 MP3 players, 300 were defective. A store clerk generates random numbers to simulate a random sample of this shipment. The clerk lets the numbers 1 through 300 represent defective MP3 players, and the numbers 301 through 5,000 represent working MP3 players. The results are given.
13 2,195 3,873 525 900 167 1,094 1,472 709 5,000
Question 3.
Based on the sample, how many of the MP3 players might the clerk predict would be defective?
_______ MP3’s
Answer: 1000 MP3’s.
Explanation: As the two random numbers are 13 and 167 as they are less than 300 and thus represent defective MP3 players. And the other 8 numbers are greater than 300 and represent working MP3 players. So the total number of randomly generated numbers is 10.
2/10 = X/5000
1/5 = X/5000
X = 1000.
So, about 1000 MP3 players are defective.
Question 4.
Can the manufacturer assume the prediction is valid? Explain.
_______
Answer: No.
Explanation: As the manufacturer cannot assume the prediction is valid. As the sample size of 10 is too small compared to the size of the shipment.
Essential Question
Question 5.
How can you use random samples to solve real-world problems?
Answer: We can use random samples to make a prediction about the population that is too large to survey.
Selected Response – Page No. 330
Question 1.
A farmer is using a random sample to predict the number of broken eggs in a shipment of 3,000 eggs. Using a calculator, the farmer generates the following random numbers. The numbers 1–250 represent broken eggs.
477 2,116 1,044 81 619 755 2,704 900 238 1,672 187 1,509
Options:
a. 250 broken eggs
b. 375 broken eggs
c. 750 broken eggs
d. 900 broken eggs
Answer: 750 broken eggs.
Explanation: Three random numbers are 81, 187, 238 which are less than 250 and represent broken eggs, so
3/12 = X/3000
1/4 = X/3000
4X = 3000
X= 750
Question 2.
A middle school has 490 students. Mae surveys a random sample of 60 students and finds that 24 of them have pet dogs. How many students are likely to have pet dogs?
Options:
a. 98
b. 196
c. 245
d. 294
Answer: 196.
Explanation: Let the number of students is likely to have pet dogs be X, so
24/60 = X/490
60X = 24×490
60X = 11,760
X = 196.
Question 3.
A pair of shoes that normally costs $75 is on sale for $55. What is the percent decrease in the price, to the nearest whole percent?
Options:
a. 20%
b. 27%
c. 36%
d. 73%
Answer: 27%
Explanation: The percent decrease in the price is \(\frac{75-55}{75}
= \frac{20}{75}\)
= 0.266= 27%
Question 4.
Which of the following is a random sample?
Options:
a. A radio DJ asks the first 10 listeners who call in if they liked the last song.
b. 20 customers at a chicken restaurant are surveyed on their favorite food.
c. A polling organization numbers all registered voters, then generates 800 random integers. The polling organization interviews the 800 voters assigned those numbers.
d. Rebecca used an email poll to survey 100 students about how often they use the internet.
Answer:
A is biased because it is a voluntary survey.
B is biased because only 20 customers surveyed on their favorite food.
C is a sample because that is random.
D is biased students using email more likely to use the internet that students who don’t use email.
Question 5.
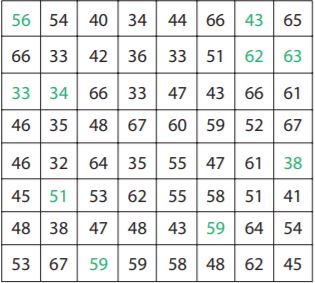
Each cell in the table represents the number of people who work in one 25-square-block section of the town of Middleton. The mayor uses a random sample to estimate the average number of workers per block.
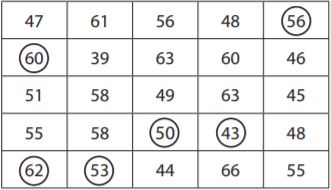
a. The circled numbers represent the mayor’s random sample. What is the mean number of workers in this sample?
______
Answer: The mean is 54.
Explanation: The mean is \(\frac{56+60+50+43+62+53}{6}
= \frac{324}{6}\)
= 54
Question 5.
b. Predict the number of workers in the entire 25-block section of Middleton.
______
Answer: 1,350.
Explanation: As we know that the mean is 54 per block, so for the entire 25 block section, the number is 54×25= 1,350.
Summary:
We wish the information given in the Go Math Answer Key Grade 7 Chapter 10 Random Samples & Populations is helpful for you. The main aim of our team is to make you understand the concepts and improve your math skills. Learn the techniques and apply them in real-time this helps you to perform well in the exams. For any queries, you can comment in the below comment box. All the Best!!!