Students who are looking for Big Ideas Math Answers Grade 6 Chapter 9 Statistical Measures pdf can get them on this page. In order to help you guys, we have prepared the Big Ideas Math Answers Grade 6 in pdf format to prepare in offline mode. Hit the links attached in the below section to know the topics covered in the Statistical Measures chapter. Hence Download Big Ideas Math Answers Grade 6 Chapter 9 Statistical Measures pdf for free and start practicing the problems now.
Big Ideas Math Book 6th Grade Answer Key Chapter 9 Statistical Measures
Know the concept of the statistical measures with the help of our Big Ideas Math Grade 6 Solution Key Chapter 9. This BIM 6th Grade Chapter 9 Statistical Measures download pdf will help the students to overcome the difficulties in maths and also to improve their performance in the exams. You can score good marks in exams by referring to our Big Ideas Math Book 6th Grade Answer Key Chapter 9 Statistical Measures.
Performance Task
Lesson: 1 Introduction to Statistics
Lesson: 2 Mean
Lesson: 3 Measures of Center
Lesson: 4 Measures of Variation
Lesson: 5 Mean Absolute Deviation
Chapter 9: Statistical Measures
- Statistical Measures Connecting Concepts
- Statistical Measures Chapter Review
- Statistical Measures Practice Test
- Statistical Measures Cumulative Practice
Statistical Measures STEAM Video/Performance Task
STEAM Video
Daylight in the Big City
Averages can be used to compare different sets of data. How can you use averages to compare the amounts of day light in different cities? Can you think of any other real-life situations where averages are useful?

Watch the STEAM Video “Daylight in the Big City.” Then answer the following questions.
1. Why do different cities have different amounts of daylight throughout the year?
Answer:
Our amount of daylight hours depends on our latitude and how Earth orbits the sun. This causes a seasonal variation in the intensity of sunlight reaching the surface and the number of hours of daylight. The variation in intensity results because the angle at which the sun’s rays hit the Earth changes with the time of year.
2. Robert’s table includes the difference of the greatest amount of daylight and the least amount of daylight in Lagos, Nigeria, and in Moscow, Russia.
Lagos: 44 minutes
Moscow:633 minutes
Use these values to make a prediction about the difference between the greatest amount of daylight and the least amount of daylight in a city in Alaska.
Answer:
The least daylight in Alaska is 1092 minutes in Juneau
The greatest daylight in Alaska is 1320 minutes in Fairbanks
Performance Task
Which Measure of Center Is Best: Mean, Median, or Mode?
After completing this chapter, you will be able to use the concepts you learned to answer the questions in the STEAM Video Performance Task. You will be given the greatest and least amounts of daylight in the 15 cities in the United States with the greatest populations.
s

You will determine which measure of center best represents the data. Why might someone be interested in the amounts of daylight throughout the year in a city?
Statistical Measures Getting Ready for Chapter 9
Chapter Exploration
Work with a partner. Write the number of letters in each of your first names on the board.
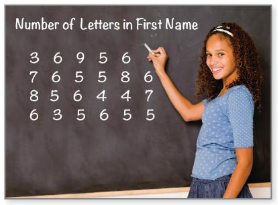
1. Write all of the numbers on a piece of paper. The collection of numbers is called data.
2. Talk with your partner about how you can organize the data. What conclusions can you make about the numbers of letters in the first names of the students in your class?
3. Draw a grid like the one shown below. Then use the grid to draw a graph of the data.
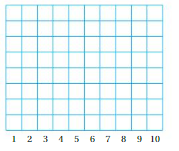
Answer:
3,6,9,5,6,7,6,5,5,8,6,8,5,6,4,4,7,6,3,5,6,5,5
4. THE CENTER OF THE DATA Use the graph of the data in Exercise 3 to answer the following.
a. Is there one number that occurs more than any of the other numbers? If so, write a sentence that interprets this number in the context of your class.
b. Complete the sentence, “In my class, the average number of letters in a student’s first name is __________.” Justify your reasoning.
c. Organize your data using a different type of graph. Describe the advantages or disadvantages of this graph.
Answer:
a. Yes, 6, 5, 8 are more than other numbers given in the data.
b. “In my class, the average number of letters in a student’s first name is 5 and 6.
Vocabulary
The following vocabulary terms are defined in this chapter. Think about what each term might mean and record your thoughts.
statistical question
measure of center
measure of variation
mean
median
range
Lesson 9.1 Introduction to Statistics
EXPLORATION 1
Using Data to Answer a Question
Work with a partner.
a. Use your pulse to find your heart rate in beats per minute.

b. Collect the recorded heart rates of the students in your class, including yourself. How spread out are the data? Use a diagram to justify your answer.
c. REASONING How would you answer the following question by using only one value? Explain your reasoning.
“What is the heart rate of a sixth-grade student?”
Answer: Your pulse is measured by counting the number of times your heart beats in one minute. For example, if your heart contracts 72 times in one minute, your pulse would be 72 beats per minute (BPM).
EXPLORATION 2
Identifying Types of Questions
Work with a partner.
a. Answer each question on your own. Then compare your answers with your partner’s answers. For which questions should your answers be the same? For which questions might your answers be different?
1. How many states are in the United States?
Answer: There are 50 states in the United States.
2. How much does a movie ticket cost? Math Practice
Answer: $9.16
3. What color fur do bears have? Build Arguments How can comparing your answers help you support your conjecture?
Answer: The color white becomes visible to our eyes when an object reflects back all.
4. How tall is your math teacher?
b. CONJECTURE
Some of the questions in part(a) are considered statistical questions. Which ones are they? Explain.
Answer: 5.10 inches

Statistics is the science of collecting, organizing, analyzing, and interpreting data. A statistical question is one for which you do not expect to get a single answer. Instead, you expect a variety of answers, and you are interested in the distribution and tendency of those answers.
Try It
Determine whether the question is a statistical question. Explain.
Question 1.
What types of cell phones do students have in your class?
Answer:
Smartphones, Cell phones give students access to tools and apps that can help them complete and stay on top of their class work. These tools can also teach students to develop better study habits, like time management and organization skills.
Question 2.
How many desks are in your classroom?
Answer: 25
Question 3.
How much do virtual-reality headsets cost?
Answer: $499
Question 4.
How many minutes are in your lunch period?
Answer: 45 minutes
A dot plot uses a number line to show the number of times each value in a data set occurs. Dot plots show the spread and the distribution of a data set.
Question 5.
Repeat parts (a)–(c)using the dot plot below that shows the times of students in a 100-meter race.

Answer:
Self-Assessment for Concepts & Skills
Solve each exercise. Then rate your understanding of the success criteria in your journal.
Question 6.
VOCABULARY
What is a statistical question? Give an example and a non-example.
Answer:
Eg for statistical question: a. How much do bags of pretzels cost at the grocery store?
Because you can anticipate that the prices will vary, it is a statistical question. table at the right may represent the prices of several bags of pretzels at a grocery store.
Eg for non-statistical question: b. How many days does your school have off for spring break this year?
Answer: Because there is only one answer, it is not a statistical question.
Question 7.
OPEN-ENDED
Write and answer a statistical question using the dot plot. Then find and interpret the number of data values.

Answer: There are 16 data values on the dot plot.
Question 8.
You record the amount of snowfall each day for several days. Then you create the dot plot.

a. Find and interpret the number of data values on the dot plot.
Answer: There are 13 data values on the dot plot.
b. How can you collect these data? What are the units?
Answer: We can collect the data by using the dots given in the above figure.
c. Write a statistical question that you can answer using the dot plot. Then answer the question.
Answer: dot plots are best used to show a distribution of data.
Question 9.
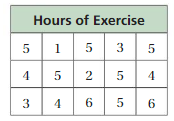
You conduct a survey to answer, “How many hours does a typical sixth-grade student spend exercising during a week?” Use the data in the table to answer the question.
Answer:
Given the data
5, 1, 5, 3, 5, 4, 5, 2, 5, 4, 3, 4, 6, 5, 6
The typical sixth-grade student spend exercising during a week is 6 hours.
Introduction to Statistics Homework & Practice 9.1
Review & Refresh
Solve the inequality. Graph the solution.
Question 1.
x – 16 > 8
Answer: x>3.

Question 2.
p + 6 ≤ 8
Answer: p ≤ 2

Question 3.
54 > 6k
Answer: 9>k

Question 4.
\(\frac{m}{12}\) ≥ 3
Answer: m ≤ 36
Tell whether the ordered pair is a solution of the equation.
Question 5.
y = 4x; (2, 8)
Answer: The given ordered pair is a solution of the equation.
Given : y = 4x;(2,8)
y=8;x=2
8=4 × 2
8=8 (satisfied)
Question 6.
y = 3x + 5; (3, 15)
Answer: Given order pair is not an absolute solution of ordered pair
Given: y = 3x + 5; (3, 15)
y=15;x=3
15=3(3)+5
15=9+5
15=14 (not satisfied)
Question 7.
y = 6x – 15; (4, 9)
Answer:
The given ordered pair is a solution of the equation.
Given: y = 6x – 15; (4, 9)
9=6(4)-15
9=24-15
9=9
Question 8.
A point is reflected in the x-axis. The reflected point is (4, −3). What is the original point?
A. (-3, 4)
B. (-4, 3)
C. (-4, -3)
D. (4, 3)
Answer: B,(-4,3)
Order the numbers from least to greatest.
Question 9.
24%, \(\frac{1}{4}\) , 0.2, \(\frac{7}{20}\) , 0.32
Answer:0.24,0.25,0.2.0.35,0.32
0.2,0.24,0.32,0.35
Question 10.
\(\frac{7}{8}\), 85%, 0.88, \(\frac{3}{4}\) , 78%
Answer:0.875,0.78,0.88,0.75,0.78
0.75,0.78,0.85,0.875,0.88
Concepts, Skills, &Problem Solving
IDENTIFYING TYPES OF QUESTIONS Answer the question. Tell whether your answer should be the same as your classmates’. (See Exploration 2, p. 413.)
Question 11.
How many inches are in 1 foot?
Answer: 12 inches
Question 12.
How many pets do you have?
Answer: none
Question 13.
On what day of the month were you born?
Answer: 27th April
Question 14.
How many senators are in Congress?
Answer: The Senate is composed of 100 Senators, 2 for each state. Until the ratification of the 17th Amendment in 1913, Senators were chosen by state legislatures, not by popular vote. Since then, they have been elected to six-year terms by the people of each state.
IDENTIFYING STATISTICAL QUESTIONS
Determine whether the question is a statistical question. Explain.
Question 15.
What are the eye colors of sixth-grade students?
Answer: brown
Question 16.
At what temperature (in degrees Fahrenheit) does water freeze?
Answer: 32 degrees Fahrenheit
Question 17.
How many pages are in the favorite books of students your age?
Answer: 200 pages
Question 18.
How many hours do sixth-grade students use the Internet each week?
Answer: 1.5 hour each
Question 19.
MODELING REAL LIFE
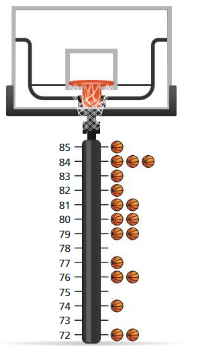
The vertical dot plot shows the heights of the players on a recent NBA championship team.
a. Find and interpret the number of data values on the dot plot.
b. How can you collect these data? What are the units?
c. Write a statistical question that you can answer using the dot plot. Then answer the question.
Answer:
Question 20.
MODELING REAL LIFE
The dot plot shows the lengths of earthworms.

a. Find and interpret the number of data values on the dot plot.
Answer: There are 21 data values on the plot.
b. How can you collect these data? What are the units?
Answer: Based on dot plots and units are measured in mm.
c. Write a statistical question that you can answer using the dot plot. Then answer the question.
Answer: Find the mode of the length of earthworms using the dot plot.
23 is repeated times.
So, the mode is 23.
DESCRIBING DATA
Display the data in a dot plot. Identify any clusters, peaks, or gaps in the data.
Question 21.
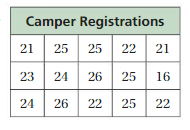
Answer:
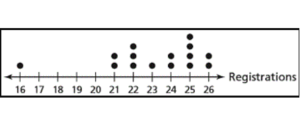
Data are clustered around 22 and around 25
Peak at 25
The gap between 16 and 21
Question 22.
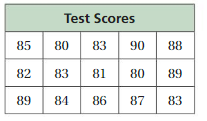
Answer:
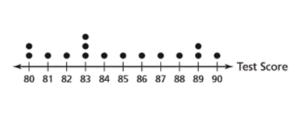
No clusters
Peak at 83
No gaps
INTERPRETING DATA
The dot plot shows the speeds of cars in a traffic study. Estimate the speed limit. Explain your reasoning.
Question 23.

Answer: Most of the data clustered around 44 and 45 , hence the estimated speed is between 44-45 miles per hour
Question 24.

Answer: Most of the data clustered around 65 , there is a peak at 65 and gaps between”60-62″ and 63-65.
Question 25.
DIG DEEPER!
You conduct a survey to answer, “How many hours does a sixth-grade student spend on homework during a school night?” The table shows the results.
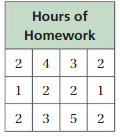
a. Is this a statistical question? Explain.
Answer: yes, it is a statistical question because students work in the different time zone based on individual student capacity.
b. Identify any clusters, peaks, or gaps in the data.
Answer: cluster is around 2. There is a peak at 2 and there is no gap.
c. Use the distribution of the data to answer the question.
Answer: A total of 29 data values are distributed.
RESEARCH
Use the Internet to research and identify the method of measurement and the units used when collecting data about the topic.
Question 26.
wind speed
Answer: The instruments used to measure wind are known as anemometers and can record wind speed, direction, and the strength of gusts. The normal unit of wind speed is the knot (nautical mile per hour = 0.51 m sec-1 = 1.15 mph).
Question 27.
amount of rainfall
Answer:
The standard instrument for the measurement of rainfall is the 203mm (8 inches) rain gauge. This is essentially a circular funnel with a diameter of 203mm which collects the rain into a graduated and calibrated cylinder. The measuring cylinder can record up to 25mm of precipitation
Question 28.
earthquake intensity
Answer: The Richter scale measures the largest wiggle (amplitude) on the recording, but other magnitude scales measure different parts of the earthquake. The USGS currently reports earthquake magnitudes using the Moment Magnitude scale, though many other magnitudes are calculated for research and comparison purposes.
Question 29.
REASONING
Write a question about letters in the English alphabet that is not a statistical question. Then write a question about letters that is a statistical question. Explain your reasoning.
Answer: Statistical Question: How many letters in the English alphabet are used to spell a student’s name in class?
Reasoning: The original question has one answer. This Question will have many answers.
Question 30.
REASONING
A bar graph shows the favorite colors of 30 people. Does it make sense to describe clusters in the data? peaks? gaps? Explain.
Answer: No, It doesn’t make sense to describe the distribution. Colors are not measures numerically.
Lesson 9.2 Mean
EXPLORATION 1
Finding a Balance Point
Work with a partner. The diagrams show the numbers of tokens brought to a batting cage. Where on the number line is the data set balanced ? Is this a good representation of the average? Explain.
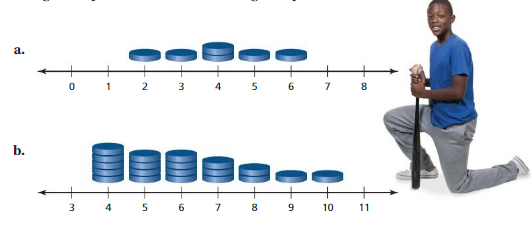
EXPLORATION 2
Finding a Fair Share
Work with a partner. One token lets you hit 12 baseballs in a batting cage. The table shows the numbers of tokens six friends bring to the batting cage.

a. Regroup the tokens so that everyone has the same amount. How many times can each friend use the batting cage? Explain how this represents a “fair share. “Use Clear Definitions What does it mean for data to have an average? How does this help you answer the question?
b. how can you find the answer in part(a) algebraically?
c. Write a statistical question that can be answered using the value in part(a).
Answer:

Try It
Find the mean of the data.
Question 1.
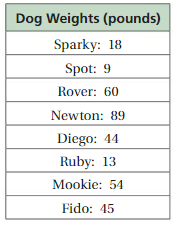
Answer:
The sum of the data/no of values
The sum of the data=45+54+13+44+89+60+9+18;
no of values=8
The sum of the data=332:no of values=8; 332/8=41.5 is the mean of the data
Question 2.
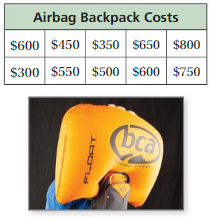
Answer:
555 is mean for the above-given data.
Question 3.
WHA IT?
The monthly rainfall in May was 0.5 inch in City A and 2 inches in City B. Does this affect your answer in Example 2? Explain.
Answer:
Self-Assessment for Concepts & Skills
Solve each exercise. Then rate your understanding of the success criteria in your journal.
Question 4.
NUMBER SENSE
Is the mean always equal to a value in the data set? Explain.
Answer: It is the value that is most common. You will notice, however, that the mean is not often one of the actual values that you have observed in your data set. In addition, the mean is the only measure of central tendency where the sum of the deviations of each value from the mean is always zero.
Question 5.
WRITING
Explain why the mean describes a typical value in a data set.
Answer:
A measure of central tendency is a single value that attempts to describe a set of data by identifying the central position within that set of data. The mean (often called the average) is most likely the measure of central tendency that you are most familiar with, but there are others, such as the median and the mode.
Question 6.
NUMBER SENSE
What can you determine when the mean of one data set is greater than the mean of another data set? Explain your reasoning.
Answer:
Question 7.
COMPARING MEANS
Compare the means of the data sets.
Data set A: 43, 32, 16, 41, 24, 19, 30, 27
Data set B: 44, 18, 29, 24, 36, 22, 26, 21
Answer:
An outlier is a data value that is much greater or much less than the other values. When included in a data set, it can affect the mean.
Question 8.
DIG DEEPER!
The monthly numbers of customers at a store in the first half of a year are 282, 270, 320, 351, 319, and 252. The monthly numbers of customers in the second half of the year are 211, 185, 192, 216, 168, and 144. Compare the mean monthly customers in the first half of the year with the mean monthly customers in the second half of the year.
Answer:
Question 9.
The table shows tournament finishes for a golfer. What place does the golfer typically finish in tournaments? Explain how you found your answer.
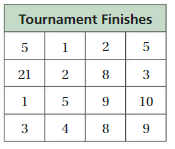
Answer: Mean=sum of data/number of data values
Mean=118/16
Mean=7.375
a. The golfer’s mean finish was about 7th
b. The finishes 37 and 26 are much greater than other finishes. They are outliers
Mean Homework & Practice 9.2
Review & Refresh
Determine whether the question is a statistical question. Explain.
Question 1.
How tall are sixth-grade students?
Answer: The average height for a sixth grader (age 12) is about five feet. Girls tend to be about an inch taller on average. But there is a wide range. Any height from about 52 inches (4′4″) to 65 inches (5′5″) is in the normal range according to the CDC.
Question 2.
How many minutes are there in 1 Year?
Answer:
An average Gregorian year is 365.2425 days (52.1775 weeks, 8765.82 hours, 525949.2 minutes, or 31556952 seconds). For this calendar, a common year is 365 days (8760 hours, 525600 minutes, or 31536000 seconds), and a leap year is 366 days (8784 hours, 527040 minutes, or 31622400 seconds).
Question 3.
How many counties are in Tennessee?
Answer: Tennessee’s 95 counties are divided into four TDOT regions. Regional offices are located in Jackson (Region 4), Nashville (Region 3), Chattanooga (Region 2), and Knoxville (Region 1).
Question 4.
What is a student’s favorite sport?
Answer: cricket
Write the percent as a fraction or mixed number in simplest form.
Question 5.
84%
Answer:0.84
Question 6.
71%
Answer:0.71
Question 7.
353%
Answer:3.53
Question 8.
0.2%
Answer:0.002
Divide. Check your answer.
Question 9.
11.7 ÷ 9
Answer:1.3
Question 10.
\(\sqrt [ 5 ]{ 72.8 } \)
Answer: 2.35
Question 11.
\(\sqrt [ 6.8 ]{ 28.56 } \)
Answer: 1.63
Question 12.
93 ÷ 3.75
Answer:24.8
Concepts, Skills, & Problem Solving
FINDING A FAIR SHARE Regroup the amounts so that each person has the same amount. What is the amount? (See Exploration 2, p. 419.)
Question 13.
Dollars brought by friends to a fair: 11, 12, 12, 12, 12, 12, 13
Answer:
Given : 11,12,12,12,12,12,13.
Mean=Sum of data/number of data values
Mean=84/7
Mean=12
Answer = 12 dollars for each friend
Question 14.
Tickets earned by friends playing an arcade game: 0, 0, 0, 1, 1, 2, 3
Answer:
Given : 0,0,0,1,1,2,3.
Mean=Sum of data/number of data values
Mean= 7/7
Mean=1
Answer = 1 Tickets each friend
FINDING THE MEAN
Find the mean of the data.
Question 15.
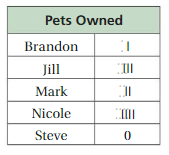
Answer: 2 is the mean of the data.
Question 16.
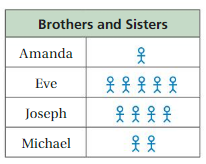
Answer: 3 is the mean of the above-given data.
Question 17.
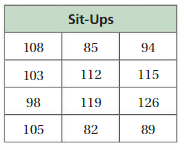
Answer: 103 is the mean of the above-given data
Question 18.
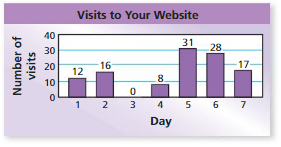
Answer: 14.8 is the mean of the above-given data.
Question 19.
MODELING REAL LIFE
You and your friends are watching a television show. One of your friends asks, “How long are the commercial breaks during this show?”Break Times (minutes)

a. Is this a statistical question? Explain.
Answer: Yes it is a statistical question.
b.Use the mean of the values in the table to answer the question.
Answer:
Given the data,
4.2, 3.5, 4.55, 2.75, 2.25
x̄ = (4.2 + 3.5 + 4.55 + 2.75 + 2.25)/5
x̄ = 17.25/5
= 3.45
Question 20.
MODELING REAL LIFE
The table shows the monthly rainfall amounts at a measuring station.

a. What is the mean monthly rainfall?
Answer:
x̄ = (22.5 + 1.51 + 1.86 + 2.06 + 3.48 + 4.47 + 3.37 + 5.40 + 5.45 + 4.34 + 2.64 + 2.14)/12
= 33.54/12
= 2.795
b. Compare the mean monthly rainfall for the first half of the year with the mean monthly rainfall for the second half of the year.
Answer:
Mean:
x̄ = (22.5 + 1.51 + 1.86 + 2.06 + 3.48 + 4.47)/6
= 15.6/6
= 2.6
For second 6 months:
x̄ = (3.37 + 5.40 + 5.45 + 4.34 + 2.64 + 2.14)/6
= 23.34/6
= 3.89
The mean value of the second 6 months is greater than the first 6 months.
Question 21.
OPEN-ENDED
Create two different data sets that have six values and a mean of 21.
Answer:
Mean of 21:
Set 1:
12, 31, 21, 24, 13, 25 for these numbers we can calculate the mean we get 21
Set 2:
12, 31, 20, 30, 10, 18 for these numbers we can calculate the mean we get 21
Question 22.
MODELING REAL LIFE
The bar graph shows your cell phone data usage for five months. Describe how the outlier affects the mean. Then use the data to answer the statistical question, “How much cell phone data do you use in a month?”
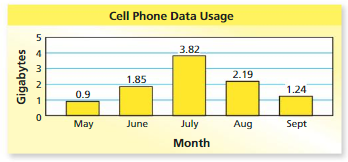
Answer: 288 is a lot less than the other data values so it is an outlier
Mean with outlier=10/5
Mean with outlier = 2
Mean without outlier = 6.18/5
Mean without outlier = 1.236
The outlier causes the mean to be about 0.76 data usage.
Question 23.
MODELING REAL LIFE
The table shows the heights of the volleyball players on two teams. Compare the mean heights of the two teams. Do outliers affect either mean? Explain.
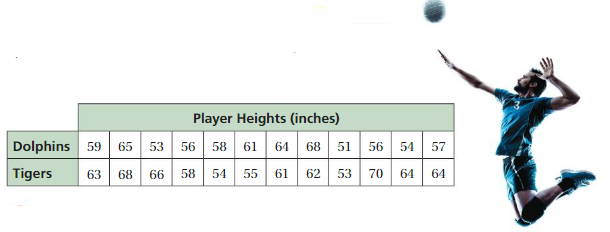
Answer:
Dolphins=59+65+53+56+58+61+64+68+51+56+54+57=702
Total no of observations=12;Mean=702\12=58.5
Tigers=63+68+66+58+54+55+61+62+53+70+64+64=683
Total no of observations=12; Mean=683/12=56.9
Question 24.
REASONING
Use a dot plot to explain why the mean of the data set below is the point where the data set is balanced.
11, 13, 17, 15, 12, 18, 12
Answer:
mean = (11 + 13 + 17 + 15 + 18 + 12)/6
= 86/6
= 14.3
Question 25.
DIG DEEPER!
In your class, 7 students do not receive a weekly allowance, 5 students receive $3, 7 students receive $5, 3 students receive $6, and 2 students receive $8.
a. What is the mean weekly allowance? Explain how you found your answer.
b. A new student who joins your class receives a weekly allowance of $3.50. Without calculating, explain how this affects the mean.
Answer:
Given number of students receive no amount = 7
Number of students receive $3 = 5
Then, total amount 5 students receive = 5 × 3 = $15
Then, total amount 7 students receive = 5 × 7 = $35
Number of students receive $6 = 3
Then total amount 3 students receive = 6 × 3 = $18
Number of students receive $8 = 2
Then, total amount 2 students receive = 2 × 8 = $16
Now, the total amount all students receive =
15 + 35 + 18 + 6 = 84
The total students = 7 + 5 + 7 + 3 + 2 = 24
Mean = total amount/total amount = 84/24 = $3.5
Hence, the mean weekly allowance is $3.5
Question 26.
PRECISION
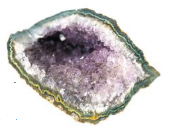
A collection of 8 geodes has a mean weight of 14 ounces. A different collection of 12 geodes has a mean weight of 14 ounces. What is the mean weight of the 20 geodes? Explain how you found your answer.
Answer:
Given,
A collection of 8 geodes has a mean weight of 14 ounces.
A different collection of 12 geodes has a mean weight of 14 ounces.
Total weight of the first 8 backpacks
8×14
112 pounds
Total weight of the second 12 backpacks
12×9
108
Total weight of the whole 20 backpacks
112+108
220
So the mean weight of the 20 backpacks
220 / 20
11
Lesson 9.3 Measures of Center
EXPLORATION 1
Finding the Median
Work with a partner.
a. Write the total numbers of letters in the first and last names of 15 celebrities, historical figures, or people you know. One person is already listed for you.
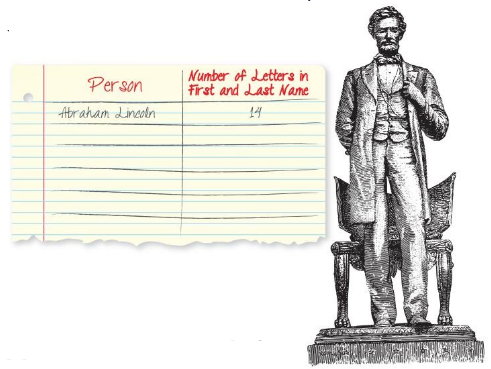
Dr. B. R. Ambedkar-8
Otto von Bismarck-15
A. P. J. Abdul Kalam-10
Vallabhbhai Patel-16
Alexander Hamilton-17
Jawaharlal Nehru -15
Mother Teresa -12
Thomas Jefferson-15
J. R. D. Tata -4
Indira Gandhi -12
Sachin Tendulkar-15
Napoleon Bonaparte-17
John Adams-9
Karl Marx-8
Andrew Jackson-13
b. Order the values in your data set from least to greatest. Then write the data on a strip of grid paper with 15 boxes.
![]()
c. The middle value of the data set is called the median. The value (or values) that occur most often is called the mode. Find the median and the mode of your data set. Explain how you found your answers.
d. Why are the median and the mode considered averages of a data set?
Answer:
A measure of center is a measure that describes the typical value of a data set. The mean is one type of measure of center. Here are two others.
Try It
Question 1.
Find the median and mode of the data.1, 2, 20, 4, 17, 8, 12, 9, 5, 20, 13
Answer: Given the data,
1, 2, 20, 4, 17, 8, 12, 9, 5, 20, 13
First, write the numbers in the ascending or descending order.
1, 2, 4, 5, 8, 9, 12, 13, 17, 20, 20
The Median is 9.
The mode is 20 because it is repeated more than once.
Question 2.
100, 75, 90, 80, 110, 102
Answer:
Given the data,
100, 75, 90, 80, 110, 102
First, write the numbers in the ascending or descending order.
75, 80, 90, 100, 102, 110
= (90+100)/2
= 85
Mode:
No mode in the data.
Question 3.
One member of the class was absent and ends up voting for horror. Does this change the mode? Explain.
Answer: No
Question 4.
The times (in minutes) it takes six students to travel to school are 8, 10, 10, 15, 20, and 45. Find the mean, median, and mode of the data with and without the outlier. Which measure does the outlier affect the most?
Answer:
Median:
Write the numbers in ascending or descending order
8, 10, 10, 15, 20, and 45
= (10 + 15)/2 = 25/2 = 12.5
Mode:
10 is the mode. Because it is the most repeated number.
Mean:
Adding up the values and then dividing by the number of values.
= (8 + 10 + 10 + 15 + 20 + 45)/6
= 108/6
= 18
Question 5.
WHAT IF?
The store decreases the price of each video game by$3. How does this decrease affect the mean, median, and mode?
Answer:
Self-Assessment for Concepts & Skills
Solve each exercise. Then rate your understanding of the success criteria in your journal.
Question 6.
FINDING MEASURES OF CENTER
Consider the data set below.
15, 18, 13, 11, 12, 21, 9, 11
a. Find the mean, median, and mode of the data.
Answer:
Given the data,
15, 18, 13, 11, 12, 21, 9, 11
x̄ = (15 + 18 + 13 + 11 + 12 + 21 + 9 + 11)/8
x̄ = 110/8
x̄ = 13.75
Median:
Write the numbers in ascending order and descending order.
9, 11, 11, 12, 13, 15, 18, 21
= (12 + 13)/2
= 12.5
Mode:
11 is the mode because this is repeated more than one time.
b. Each value in the data set is decreased by 7. How does this change affect the mean, median, and mode?
Answer:
Each value is decreased by 7 in the given data
8, 11, 6, 4, 5, 14, 2, 4
x̄ = (8 + 11 + 6 + 4 + 5 + 14 + 2 + 4)/8
x̄ = 54/8
x̄ = 6.75
Question 7.
WRITING
Explain why a typical value in a data set can be described by the median or the mode.
Answer:
For data from skewed distributions, the median is better than the mean because it isn’t influenced by extremely large values. The mode is the only measure you can use for nominal or categorical data that can’t be ordered
Question 8.
How does removing the outlier affect your answer in Example 5?
Answer:
Question 9.
It takes 10 contestants on a television show 43, 41, 62, 40, 44, 43, 44, 46, 45, and 41 seconds to cross a canyon on a zipline. Find the mean, median, and mode of the data with and without the outlier. Which measure does the outlier affect the most?
Answer:
Question 10.
The table shows the weights of several great white sharks. Use the data to answer the statistical question, “What is the weight of a great white shark?”

Answer:
Measures of Center Homework & Practice 9.3
Review & Refresh
Find the mean of the data.
Question 1.
1, 5, 8, 4, 5, 7, 6, 6, 2, 3
Answer: 4.7
Explanation:
Given the data,
1, 5, 8, 4, 5, 7, 6, 6, 2, 3
x̄ = ∑x/n
x̄ = (1 + 5 + 8 + 4 + 5 + 7 + 6 + 6 + 2 + 3)/16
x̄ = 49/16
x̄ = 3.06
Question 2.
9, 12, 11, 11, 10, 7, 4, 8
Answer: 9
Explanation:
Given the data,
9, 12, 11, 11, 10, 7, 4, 8
x̄ = ∑x/n
x̄ = (9 + 12 + 11 + 11 + 10 + 7 + 4 + 8)/8
x̄ = 72/8
x̄ = 9
Question 3.
26, 42, 31, 50, 29, 37, 44, 31
Answer: 36.25
Explanation:
Given the data,
26, 42, 31, 50, 29, 37, 44, 31
x̄ = ∑x/n
x̄ = (26+42+31+50+29+37+44+31)/8
x̄ = 290/8
x̄ = 36.25
Question 4.
53, 45, 43, 55, 28, 21, 61, 29, 24, 40, 27, 42
Answer: 39
Explanation:
Given the data,
53, 45, 43, 55, 28, 21, 61, 29, 24, 40, 27, 42
x̄ = ∑x/n
x̄ = (53+45+43+55+28+21+61+29+24+40+27+42)/12
x̄ = 468/12
x̄ = 39
Question 5.
A shelf in your room can hold at most 30 pounds. ere are 12 pounds of books already on the shelf. Which inequality represents the number of pounds you can add to the shelf?
A. x < 18
B. x ≥ 18
C. x ≤ 42
D. x ≤ 18
Answer: x ≤ 18
Explanation:
12+x ≤ 30
12+x -12 ≤ 30-12
x ≤ 18
Find the missing values in the ratio table. Then write the equivalent ratios.
Question 6.

Answer:

Question 7.

Answer:

Find the surface area of the prism.
Question 8.
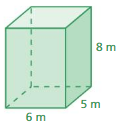
Answer:
Given,
l = 6m
w = 5m
h = 5m
We know that,
Surface Area of the Prism = 2lw + 2lh + 2hw
= 2(6 × 5) + 2(6 × 8) + 2(8 × 5)
= 60 + 96 + 80
= 236 sq. meters
Question 9.
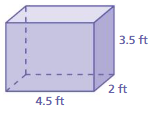
Answer:
Given,
l = 4.5 ft
w = 2ft
h = 3.5ft
We know that,
Surface Area of the Prism = 2lw + 2lh + 2hw
= 2(4.5 × 2) + 2(4.5 × 3.5) + 2(2 × 3.5)
= 18 + 31.5 + 14
= 63.5 sq. ft
Question 10.
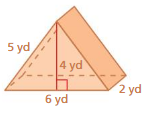
Answer:
Given,
l = 6 yd
w = 4 yd
h = 2 yd
We know that,
Surface Area of the Prism = bh + 2lh + lb
= 2 × 4 + 2(6 × 5) + 6 × 2
= 8 + 60 + 12
= 80 sq. yards
Concepts, Skills, & Problem Solving
FINDING THE MEDIAN Use grid paper to find the median of the data. (See Exploration 1, p. 425.)
Question 11.
9, 7, 2, 4, 3, 5, 9, 6, 8, 0, 3, 8
Answer:
First, arrange the numbers in ascending or descending order.
= 0, 2, 3, 3, 4, 5, 6, 7, 8, 8, 9, 9
= (5 + 6)/2
= 11/2
= 5.5
Question 12.
16, 24, 13, 36, 22, 26, 22, 28, 25
Answer:
First, arrange the numbers in ascending or descending order.
13, 16, 22, 22, 24, 25, 26, 28, 36
24 is the median.
The median is the middle score in a set of given data.
FINDING THE MEDIAN AND MODE
Find the median and mode of the data.
Question 13.
3, 5, 7, 9, 11, 3, 8
Answer: The Median is 7; The Mode is 3.
Given: 3, 5, 7, 9, 11, 3, 8
Sorted list: 3,3,5,7,8,9,11
Median is the middle number in a sorted list of numbers = 7
The mode is the value that appears most frequently in a data set = 3
Question 14.
14, 19, 16, 13, 16, 14
Answer: The Median is 15; The Modes are 14 and 16.
Given: 13,14,14,16,16,19
Sorted list: 14, 19, 16, 13, 16, 14
Median is the middle number in a sorted list of numbers = 15
The mode is the value that appears most frequently in a data set = 14,16
Question 15.
16. 93, 81, 94, 71, 89, 92, 94, 99
Answer: The Median is 90.5; The Mode is 94.
Given: 16, 93, 81, 94, 71, 89, 92, 94, 99
Sorted list: 16,71,81,89,92,93,94,94,99
Median is the middle number in a sorted list of numbers = 92
The mode is the value that appears most frequently in a data set = 94
Question 16.
44, 13, 36, 52, 19, 27, 33
Answer: The Median is 33; There are no modes.
Given: 44, 13, 36, 52, 19, 27, 33
Sorted list: 13,19,27,33,36,44,52
Median is the middle number in a sorted list of numbers = 33
The mode is the value that appears most frequently in a data set = no mode
Question 17.
12, 33, 18, 28, 29, 12, 17, 4, 2
Answer: The Median is 17; The Modes are 12.
Given: 12, 33, 18, 28, 29, 12, 17, 4, 2
Sorted list: 2,4,12,12,17,18,28,29,33
Median is the middle number in a sorted list of numbers = 17
The mode is the value that appears most frequently in a data set = 12
Question 18.
55, 44, 40, 55, 48, 44, 58, 67
Answer:
The Median is 51.5
The Modes are 44 and 55.
Given: 55, 44, 40, 55, 48, 44, 58, 67
Sorted list: 40,44,44,48,55,55,58,67
Median is the middle number in a sorted list of numbers = 51.5
The mode is the value that appears most frequently in a data set = 44,55
Question 19.
YOU BE THE TEACHER
Your friend finds the median of the data. Is your friend correct? Explain your reasoning.
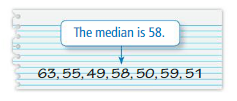
Answer: No, first the given data is arranged in ascending order then after median is to be found. The median is 55
FINDING THE MODE
Find the mode of the data.
Question 20.
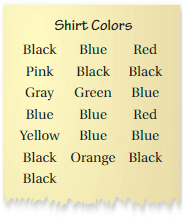
Answer: The modes are Black and Blue.
Question 21.

Answer: The modes are singing, dancing, comedy.
Question 22.
REASONING
In Exercises 20 and 21, can you find the mean and median of the data? Explain.
Answer: You can’t find the mean and median in exercises 20 and 21.
The data set is not made up of numbers
FINDING MEASURES OF CENTER
Find the mean, median, and mode of the data.
Question 23.
4.7, 8.51, 6.5, 7.42, 9.64, 7.2, 9.3
Answer: Given: 4.7, 8.51, 6.5, 7.42, 9.64, 7.2, 9.3
Sorted list: 4.7, 6.5, 7.2, 7.42, 8.51, 9.64
Mean: x̄ = ∑x/n
x̄ = (4.7+6.5+7.2+7.42+8.51+9.64)/6
x̄ = 43.97/6
x̄ =7.32
Median: 7.42.
Mode: no mode.
Question 24.
8\(\frac{1}{2}\), 6\(\frac{5}{8}\), 3\(\frac{1}{8}\), 5\(\frac{3}{4}\), 6\(\frac{5}{8}\), 5\(\frac{1}{4}\), 10\(\frac{5}{8}\), 4\(\frac{1}{2}\)
Answer: Given: 8.5, 6.62, 3.12, 5.75, 6.62, 5.25, 10.62, 4.5
Sorted list: 3.12, 4.5, 5.25, 5.75, 6.62, 6.62, 8.5, 10.62
Mean: x̄ = ∑x/n
x̄ = (3.12, 4.5, 5.25, 5.75, 6.62, 6.62, 8.5, 10.62)/8
x̄ =
x̄ =
Median: 6.18
Mode: 6.62
Question 25.
MODELING REAL LIFE
The weights (in ounces) of several moon rocks are shown in the table. Find the mean, median, and mode of the weights.
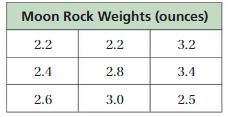
Answer:
Mean
x̄ = (2.2 + 2.2 + 3.2 + 2.4 + 2.8 + 3.4 + 2.6 + 3.0 + 2.5)/9
Median:
Write the moon rock weights in ascending or descending order.
2.6 is the median
Mode:
2.2 is repeated move times
So, 2.2 is the mode.
REMOVING AN OUTLIER Find the mean, median, and mode of the data with and without the outlier. Which measure does the outlier affect the most?
Question 26.
45, 52, 17, 63, 57, 42, 54, 58
Answer:
Outliners means removing of the small data value
17 is the outliner
x̄ = ∑x/n
= (45 + 52 + 17 + 63 + 57 + 42 + 54 + 58)/8
= 388/8 = 48.5
Mean without outliner:
= (45 + 52 + 63 + 57 + 42 + 54 + 58)/7
= 371/7 = 53
Median with outliner:
17, 42, 45, 52, 54, 57, 58, 63
= (52 + 54)/2
= 106/2
= 53
Median without outliner:
42, 45, 52, 54, 57, 58, 63
54 is the median
Mode:
There is no change of value in the without outliner and with the outliner.
So, there is no mode in the data values.
Question 27.
85, 77, 211, 88, 91, 84, 85
Answer:
77 is the outliner
Mean with outliner:
x̄ = (85 + 77 + 211 + 88 + 91 + 84 + 85)/7
=721/7
= 103
Mean without outliner:
x̄ = (85 + 211 + 88 + 91 + 84 + 85)/6
= 644/6
= 107
Median with outliner:
Write the data values in ascending or descending order.
77, 84, 85, 88, 91, 211
85 is the median.
Median without outliner:
84, 85, 85, 88, 91, 211
= (85 + 88)/2
= 173/2
= 86.5
Mode:
There is no change of value in the without outliner and with the outliner.
85 is the mode.
Question 28.
23, 73, 45, 27, 23, 25, 43, 45
Answer:
73 is the outliner
Mean with outliner:
Mean = (23 + 45 + 27 + 23 + 25 + 43 + 45)
= 231/7
= 33
Mean with outliner:
Mean = (23 + 45 + 27 + 23 + 25 + 43 + 45+ 73)
= 304/8
= 38
Question 29.
101, 110, 99, 100, 64, 112, 110, 111, 102
Answer:
64 is the outliner
Mean with outliner:
x̄ = (101 + 110 + 99 + 100 + 64 + 112 + 110 + 111 + 102)/9
= 901/9 = 101
Mean with outliner:
x̄ = (101 + 110 + 99 + 100 + 112 + 110 + 111 + 102)/8
= 755/8
= 94.37
Median:
Write the data values in ascending or descending order
64, 99, 100, 101, 102, 110, 111, 112
Median without outliner:
= (101 + 102)/2
= 203/2
= 101.5
Mode:
Mode with and without outliner = 110
Question 30.
REASONING
The table shows the monthly salaries for employees at a company.

a. Find the mean, median, and mode of the data.
b. Each employee receives a 5% raise. Find the mean, median, and mode of the data with the raise. How does this increase affect the mean, median, and mode of the data?
c. How are the mean, median, and mode of the monthly salaries related to the mean, median, and mode of the annual salaries?
Answer:
CHOOSING A MEASURE OF CENTER
Find the mean, median, and mode of the data. Choose the measure that best represents the data. Explain your reasoning.
Question 31.
48, 12, 11, 45, 48, 48, 43, 32
Answer:
Write the data in ascending order or descending order.
11, 12, 32, 43, 45, 48, 48, 48
= (32 + 43)/2
= 75/2
= 37.5
48 is the mode of the data
Question 32.
12, 13, 40, 95, 88, 7, 95
Answer:
Mean:
x̄ = ∑x/n
= (12 + 13 + 40 + 95 + 88 + 7 + 95)/7
= 350/7 = 50
Median:
7, 12, 13, 40, 88, 95, 95
40 is the median
mode:
95 is the mode.
Question 33.
2, 8, 10, 12, 56, 9, 5, 2, 4
Answer:
Mean:
x̄ = ∑x/n
= (2 + 8 + 10 + 12 + 56 + 9 + 5 + 2 + 4)/9
= 108/9
= 12
Median:
2, 2, 4, 5, 8, 9, 10, 12, 56
8 is the median
Mode:
2 is the mode.
Question 34.
126, 62, 144, 81, 144, 103
Answer:
Mean:
x̄ = ∑x/n
= (126 + 62 + 144 + 81 + 144 + 103)6
= 660/60
= 11
Median:
62, 81, 103, 126, 144, 144
= (103 + 126)/2
= 114.5
Question 35.
MODELING REAL LIFE
The weather forecast for a week is shown. Which measure of center best represents the high temperatures? the low temperatures? Explain your reasoning.

Answer:
Question 36.
RESEARCH
Find the costs of 10 different boxes of cereal. Choose one cereal whose cost will be an outlier.
a. Which measure of center does the outlier affect the most? Justify your answer.
b. Use the data to answer the statistical question, “How much does a box of cereal cost?”
Answer:
Question 37.
PROBLEM SOLVING
The bar graph shows the numbers of hours you volunteered at an animal shelter. What is the minimum number of hours you need to volunteer in the seventh week to justify that you volunteered an average of 10 hours per week for the 7 weeks? Explain your answer using measures of center.
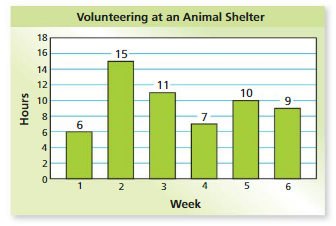
Answer:
Question 38.
REASONING
Why is the mode the least frequently used measure of center to describe a data set? Explain.
Answer:
The mode can be helpful in some analyses, but generally it does not contain enough accurate information to be useful in determining the shape of a distribution. When it is not a “Normal Distribution” the Mode can be misleading, although it is helpful in conjunction with the Mean for defining the amount of skewness in a distribution.
Question 39.
DIG DEEPER!
The data are the prices of several fitness wristbands at a store.
$130 $170 $230 $130
$250 $275 $130 $185
a. Does the price shown in the advertisement represent the prices well? Explain.

b. Why might the store use this advertisement?
c. In this situation, why might a person want to know the mean? the median? the mode? Explain.
Answer:
Question 40.
CRITICAL THINKING
The expressions 3x, 9x, 4x, 23x, 6x, and 3x form a data set. Assume x> 0.
a. Find the mean, median, and mode of the data.
b. Is there an outlier? If so, what is it?
Answer:
Mean: This is an average of all the numbers. Add up the numbers and then divide by how many numbers there are.
(3 + 9 + 4 + 23 + 6 + 3)/6 = 48/6 = 8
Median: The number in the middle, when the numbers are in order. If there are 2 middle numbers, average them together.
3, 3, 4, 6, 9, 23 : 4 and 6 are the middle numbers. 4+6/2 = 10/2 = 5
Mode: What value occurs most frequently? 3 is the only duplicate
Outlier: What value is abnormal to our set of data? All of our numbers are small (single digits), except for 23. That makes it an outlier.
Lesson 9.4 Measures of Variation
EXPLORATION 1
Interpreting Statements
Work with a partner. There are 24 students in your class. Your teacher makes the following statements.

• “The exam scores range from 75% to 96%.”
a. What does each statement mean? Explain.
b. Use your teacher’s statements to make a dot plot that can represent the distribution of the exam scores of the class.
c. Compare your dot plot with other groups’. How are they alike? different?
EXPLORATION 2
Grouping Data
Work with a partner. The numbers of U.S.states visited by students in a sixth-grade class are shown.

a. Represent the data using a dot plot. Between what values do the data range?
b. Use the dot plot to make observations about the data.
c. How can you describe the middle half of the data?
A measure of variation is a measure that describes the distribution of a data set. A simple measure of variation to find is the range. The range of a data set is the difference of the greatest value and the least value.
Try It
Question 1.
The ages of people in line for a roller coaster are 15, 17, 21, 32, 41, 30, 25, 52, 16, 39, 11, and 24. Find and interpret the range of the ages.
Answer:
Given,
The ages of people in line for a roller coaster are 15, 17, 21, 32, 41, 30, 25, 52, 16, 39, 11, and 24.
Range = (upper value – lower value)/2
= (52 – 11)/2
= 41/2
= 20.5
Question 2.
The data are the number of pages in each of an author’s novels. Find and interpret the interquartile range of the data.
356, 364, 390, 468, 400, 382, 376, 396, 350
Answer:
Given,
The data are the number of pages in each of an author’s novels.
356, 364, 390, 468, 400, 382, 376, 396, 350
Lower quartile = 360
Upper quartile = 398
Interquartile range = 38
Self-Assessment for Concepts & Skills
Solve each exercise. Then rate your understanding of the success criteria in your journal.
Question 3.
WRITING
Explain why the variability of a data set can be described by the range or the interquartile range.
Answer:
The interquartile range is the third quartile (Q3) minus the first quartile (Q1). But the IQR is less affected by outliers: the 2 values come from the middle half of the data set, so they are unlikely to be extreme scores. The IQR gives a consistent measure of variability for skewed as well as normal distributions.
Question 4.
DIFFERENT WORDS, SAME QUESTION
Which is different? Find “both” answers.
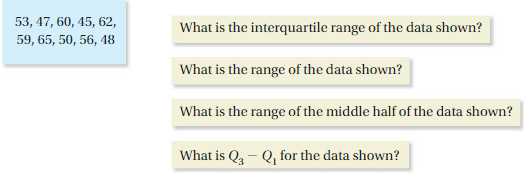
Answer:
Question 5.
The table shows the distances traveled by a paper airplane. Find and interpret the range and interquartile range of the distances.
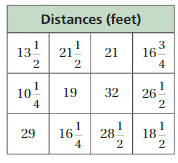
Answer: Given: 13.5, 12.5, 21, 16.75, 10.25, 19, 32, 26.5, 29,16.25, 28.5, 18.5.
Question 6.
The table shows the years of teaching experience of math teachers at a school. How do the outlier or outliers affect the variability of the data?

Answer:
Given the data
5, 10, 7, 8, 10, 11, 22, 8, 6, 35
22 is added to the data set
22 is the outliner
so there is no effect to measure of center and the measure of variability.
Measures of Variation Homework & Practice 9.4
Review & Refresh
Find the mean, median, and mode of the data.
Question 1.
4, 8, 11, 6, 4, 5, 9, 10, 10, 4
Answer:
Mean = x̄ = (4 + 8 + 11 + 6 + 4 + 5 + 9 + 10 + 10 + 4)/10
= 71/10
= 7.1
Median:
Write the data in ascending or descending order.
4, 4, 4, 5, 6, 8, 9, 10, 10, 11
= (5 + 8)/2
= 13/2
=6.5
Mode:
More number if data repeated is called mode.
4 is the mode.
Question 2.
74, 78, 86, 67, 80
Answer:
Mean = x̄ = (74 + 78 + 86 + 67 + 80)/5
= 385/5
= 77
Median:
Write the data in ascending or descending order.
67, 74, 78, 80, 86
78 is the median
Mode:
There is no mode in the data.
Question 3.
15, 18, 17, 17, 15, 16, 14
Answer:
Mean = x̄ = (15 + 18 + 17 + 17 + 15 + 16 + 14)/7
= 112/7 = 16
Median:
Write the data in ascending or descending order.
14, 15, 15, 16, 17, 17, 18
16 is the median
Mode:
17, 15 are the median.
Question 4.
31, 14, 18, 26, 17, 32
Answer:
Mean:
x̄ = (31 + 14 + 18 + 26 + 17 + 32)/6
Median:
Write the data in ascending or descending order.
14, 17, 18, 26, 31, 32
= (18 + 26)/2
= 44/2
= 22
Mode:
There is no mode in the data.
Copy and complete the statement using < or >.
Question 5.
![]()
Answer:
A negative number is less than the positive number
6 > -7
Question 6.
![]()
Answer:
A negative number is less than the positive number
-3 < 0
Question 7.
![]()
Answer:
A negative number is less than the positive number
14 > -14
Question 8.
![]()
Answer:
A negative number is less than the positive number
8 > -10
Find the surface area of the pyramid.
Question 9.
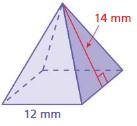
Answer:
Given,
Length = 12 mm
Height = 14 mm
A = a² + 2a √a²/4 + h²
Area = 509.56 sq. mm
Question 10.
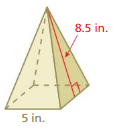
Answer:
Given,
Length = 5 in
Height = 8.5 in
A = a² + 2a √a²/4 + h²
Area = 113.6 sq. inches
Question 11.
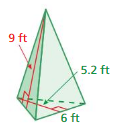
Answer:
Given,
Length = 6 ft
Height = 9 ft
A = a² + 2a √a²/4 + h²
Area = 149.84 sq.ft
Concepts, Skills, &Problem Solving
INTERPRETING STATEMENTS There are 20 students in your class. Your teacher makes the two statements shown. Use your teacher’s statements to make a dot plot that can represent the distribution of the scores of the class. (See Exploration 1, p. 433.)
Question 12.
“The quiz scores range from 65% to 95%.”
“The scores were evenly spread out.”
Answer:
Question 13.
“The project scores range from 78% to 93%.”
“Most of the students received low scores.”
Answer:
FINDING THE RANGE Find the range of the data.
Question 14.
4, 8, 2, 9, 5, 3
Answer: 7
Explanation:
Range is the difference of higher value and lower value
lowest value = 2
highest value = 9
R = 9 – 2
R = 7
Question 15.
28, 42, 36, 23, 14, 47, 40
Answer: 33
Explanation:
The range is the difference between higher value and lower value
Lowest value: 14
Highest value: 47
Range = 47 – 14
R = 33
Question 16.
26, 21, 27, 33, 24, 29
Answer: 12
Explanation:
The range is the difference between higher value and lower value
Lowest value: 21
Highest value: 33
Range = 33 – 21
R = 12
Question 17.
52, 40, 49, 48, 62, 54, 44, 58, 39
Answer: 23
Explanation:
The range is the difference between higher value and lower value
Lowest value: 39
Highest value: 62
Range = 62 – 39
R = 23
Question 18.
133, 117, 152, 127, 168, 146, 174
Answer: 57
Explanation:
The range is the difference between higher value and lower value
Lowest value: 117
Highest value: 174
Range = 174 – 117
R = 57
Question 19.
4.8, 5.5, 4.2, 8.9, 3.4, 7.5, 1.6, 3.8
Answer: 7.3
Explanation:
The range is the difference of higher value and lower value
Lowest value: 1.6
Highest value: 8.9
Range = 8.9 – 1.6
R = 7.3
Question 20.
YOU BE THE TEACHER
Your friend finds the range of the data. Is your friend correct? Explain your reasoning.
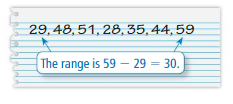
Answer:
The range is the difference between higher value and lower value
Lowest value: 28
Highest value: 59
Range = 59 – 28
Range = 31
FINDING THE INTERQUARTILE RANGE Find the interquartile range of the data.
Question 21.
4, 6, 4, 2, 9, 1, 12, 7
Answer: 6
Explanation:
This simple formula is used for calculating the interquartile range:
IQR = Xu – Xl
Lower quartile (xL): 2.5
Upper quartile (xU): 8.5
IQR = 8.5 – 2.5
IQR = 6
Question 22.
18, 22, 15, 16, 15, 13, 19, 18
Answer: 3.75
Explanation:
This simple formula is used for calculating the interquartile range:
IQR = Xu – Xl
Lower quartile (xL): 15
Upper quartile (xU): 18.75
IQR = 18.75 – 15
= 3.75
Question 23.
40, 33, 37, 54, 41, 34, 27, 39, 35
Answer: 7
Explanation:
This simple formula is used for calculating the interquartile range:
IQR = Xu – Xl
Lower quartile (xL): 33.5
Upper quartile (xU): 40.5
IQR = 40.5 – 33.5
= 7
Question 24.
84, 75, 90, 87, 99, 91, 85, 88, 76, 92, 94
Answer: 8
Explanation:
This simple formula is used for calculating the interquartile range:
IQR = Xu – Xl
Lower quartile (xL): 84
Upper quartile (xU): 92
IQR = 92 – 84
= 8
Question 25.
132, 127, 106, 140, 158, 135, 129, 138
Answer: 12
Explanation:
This simple formula is used for calculating the interquartile range:
IQR = Xu – Xl
Lower quartile (xL): 127.5
Upper quartile (xU): 139.5
IQR = 139.5 – 127.5
= 12
Question 26.
38, 55, 61, 56, 46, 67, 59, 75, 65, 58
Answer: 12.75
Explanation:
This simple formula is used for calculating the interquartile range:
IQR = Xu – Xl
Lower quartile (xL): 52.75
Upper quartile (xU): 65.5
IQR = 65.5 – 52.75
= 12.75
Question 27.
MODELING REAL LIFE
The table shows the number of tornadoes in Alabama each year for several years. Find and interpret the range and interquartile range of the data. Then determine whether there are any outliers.
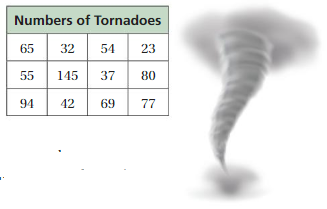
Answer:
The data is 65, 32, 54, 23, 55, 145,37, 80, 94, 42, 69, 77
Range:
Lowest value: 23
Highest value: 145
R = Highest value – Lowest value
R = 145 – 23
R = 122
IQR:
This simple formula is used for calculating the interquartile range:
IQR = Xu – Xl
Lower quartile (xL): 38.25
Upper quartile (xU): 79.25
IQR = 79.25 – 38.25
= 41
Question 28.
WRITING
Consider a data set that has no mode. Which measure of variation is greater, the range or the interquartile range? Explain your reasoning.
Answer:
It would be based on the set of numbers you have, but in most cases, it is the interquartile range, because the mode is usually closer to the median. This leaves the interquartile range as a larger number.
Question 29.
CRITICAL THINKING
Is it possible for the range of a data set to be equal to the interquartile range? Explain your reasoning.
Answer:
The interquartile range (IQR) is a measure of variability, based on dividing a data set into quartiles. Quartiles divide a rank-ordered data set into four equal parts.
Question 30.
REASONING
How does an outlier affect the range of a data set? Explain.
Answer:
Outlier An extreme value in a set of data that is much higher or lower than the other numbers. Outliers affect the mean value of the data but have little effect on the median or mode of a given set of data.
Question 31.
MODELING REAL LIFE
The table shows the numbers of points scored by players on a sixth-grade basketball team in a season.

a. Find the range and interquartile range of the data.
b. Identify the outlier(s) in the data set. Find the range and interquartile range of the data set without the outlier(s). Which measure does the outlier or outliers affect more?
Answer:
Question 32.
DIG DEEPER!
Two data sets have the same range. Can you assume that the interquartile ranges of the two data sets are about the same? Give an example to justify your answer.
Answer:
Yes,
A data set with the least value of 2 and the greatest value of 20 will have the same range as a data set with the least value of 82 and the greatest value of 100 will have the same range of 18.
Question 33.
MODELING REAL LIFE
The tables show the ages of the finalists for two reality singing competitions.
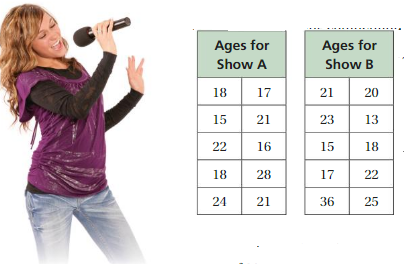
a. Find the mean, median, range, and interquartile range of the ages for each show. Compare the results.
Answer:
18, 15, 22, 18, 24, 17, 21, 16, 28, 21
Mean:
x̄ = ∑x/n = (18 + 15 + 22 + 18 + 24 + 17 + 21 + 16 + 28 + 21)/10
=200/10 = 20
Median:
15, 16, 17, 18, 18, 21, 22, 24, 28
= (18 + 21)/2
= 39/2
= 19.5
Range:
(28 – 15)/2
= 13/2
= 6.5
interquartile range:
Number of observations: 10
Xl = 16.75
Xu = 22.5
Xu – Xl = 5.75
Ages of show B:
Mean:
x̄ = ∑x/n = (21 + 20 + 23 + 13 + 15 + 18 + 17 + 22 + 36 + 25)/10
= 210/10 = 21
Median:
13, 15, 17, 18, 20, 21, 22, 23, 25, 36
= (20 + 21)/2 = 41/2 = 20.5
Range:
(36 – 13)/2
= 23/2
= 11.5
Interquartile Range:
Samples = 10
Xl = 16.5
Xu = 23.5
b. A 21-year-old is voted off Show A, and the 36-year-old is voted off Show B. How do these changes affect the measures in part(a)? Explain.
Answer:
Mean:
x̄ = ∑x/n = (18 + 17 + 15 + 22 + 16 + 18 + 28 + 24)/8
= 158/8
= 79
Median: 15, 16, 17, 18, 18, 22, 24, 28
(18 + 18)/2
= 36/2
= 18
Range:
(28 – 15)/2
= 13/2
= 6.5
Interquartile Range:
Samples = 8
Xl = 16.25
Xu = 23.5
Interquartile Range = 23.5 – 16.25
= 7.25
21, 20, 23, 13, 15, 18, 17, 22, 25
Mean = (21 + 20 + 23 + 13 + 15 + 18 + 17 + 22 + 25)/9
= 174/2
= 87
Median:
13, 15, 17, 18, 21, 20, 22, 23, 25
21 is the median
Range:
(25 – 13)/2
= 12/2
= 6
Interquartile Range:
data = 9
Xl = 16
Xu = 22.5
(Xu – Xl) = 22.5 – 16
= 6.5
In Part A there is no effect on the range and it affects the mean, median, interquartile.
Question 34.
OPEN-ENDED
Create a set of data with 7 values that has a mean of 30, a median of 26, a range of 50, and an interquartile range of 36.
Answer:
The first thing we need to do is to put the data in increasing order. This is needed to calculate the median:
30,31,32,33,34,35,35,36,37,39
Lesson 9.5 Mean Absolute Deviation
EXPLORATION 1
Finding Distances from the Mean
Work with a partner. The table shows the exam scores of 14 students in your class.

a. Which exam score deviates the most from the mean? Which exam score deviates the least from the mean? Explain how you found your answers.
b. How far is each data value from the mean?
c. Divide the sum of the values in part(b) by the number of values. In your own words, what does this represent?
d. REASONING Ina data set, what does it mean when the value you found in part(c) is close to 0? Explain.

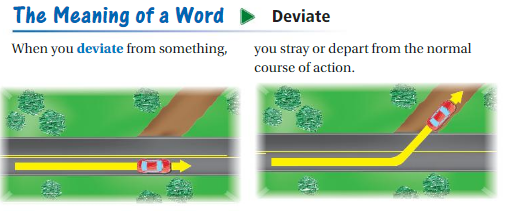
Another measure of variation is the mean absolute deviation. The mean absolute deviation is an average of how much data values differ from the mean.
Try It
Question 1.
Find and interpret the mean absolute deviation of the data.
5, 8, 8, 10, 13, 14, 16, 22
Answer: Number of observations : 8
Mean: 12
Question 2.
WHAT IF?
The pitcher allows 4 runs in the next game. How would you expect the mean absolute deviation to change? Explain.
Answer:
Self-Assessment for Concepts & Skills
Solve each exercise. Then rate your understanding of the success criteria in your journal.
Question 3.
WRITING
Explain why the variability of a data set can be described by the mean absolute deviation.
Answer:
Question 4.
FINDING THE MEAN ABSOLUTE DEVIATION
Find and interpret the mean absolute deviation of the data. 8, 12, 4, 3, 14, 1, 9, 13
Answer: number of observations:8
Mean: 8
mean absolute deviation: 4
Question 5.
WHICH ONE do DOESN’T BELONG?
Which one does not belong with the other three? Explain your reasoning.

Answer: MEAN
A mean is different from all the above-given factors
A mean is the simple mathematical average of a set of two or more numbers.
The mean for a given set of numbers can be computed in more than one way, including the arithmetic mean method, which uses the sum of the numbers in the series, and the geometric mean method, which is the average of a set of products.
Question 6.
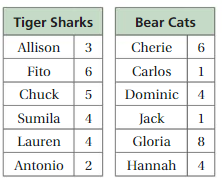
The tables show the numbers of questions answered correctly by members of two teams on a game show. Compare the mean, median, and mean absolute deviation of the numbers of correct answers for each team. What can you conclude?
Answer:
Tiger sharks
3, 6, 5, 4, 4, 2
Mean: (3 + 6 + 5 + 4 + 4 + 2)/6
= 24/6
= 4
Median:
2, 3, 4, 4, 5, 6
= (4 + 4)/2
= 4
MAD:
Number of observations: 6
Mean = 4
MAD = 1
Bear Cats:
Mean:
6, 1, 4, 1, 8, 4
(6 + 1 + 4 + 1 + 8 + 4)/6
= 24/6
= 4
Median:
1, 1, 4, 4, 6, 8
= (4 + 4)/2
= 4
MAD:
Number of observations: 6
Mean = 4
MAD = 2
The mean, Median, Mean Absolute Deviation of both tiger sharks and Bear Cats are the same.
Question 7.
DIG DEEPER!
The data set shows the numbers of books that students in your book club read last summer.
8, 6, 11, 12, 14, 12, 11, 6, 15, 9, 7, 10, 9, 13, 5, 8
A new student who read 18 books last summer joins the club. Is18 an outlier? How does including this value in the data set affect the measures of center and variation? Explain.
Answer: 8 is added to the dataset.
Yes, 18 is an outliner
No, it does not affect the measures of the center and variation by removing the outliner.
If the outliner is not removed then it affects the measures of center and variation.
Mean Absolute Deviation Homework & Practice 9.5
Review & Refresh
Find the range and interquartile range of the data.
Question 1.
23, 45, 39, 34, 28, 41, 26, 33
Answer:
Number of observations:8
Lower quartile (xL): 26.5
Upper quartile (xU): 40.5
interquartile range = 14
Range:
Number of observations:8
Lowest value: 23
Highest value: 45
Range = 45 – 23
= 22
Question 2.
63, 53, 48, 61, 69, 63, 57, 72, 46
Answer:
Number of observations:9
Lower quartile (xL): 50.5
Upper quartile (xU): 66
interquartile range = 15.5
Range:
Number of observations:9
Lowest value: 46
Highest value: 72
Range = 26
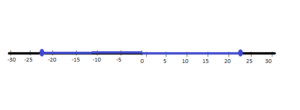
Graph the integer and its opposite.
Question 3.
15
Answer:

Question 4.
17
Answer:

Question 16.
– 22
Answer:
Question 7.
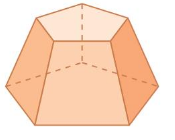
Find the numbers of faces, edges, and vertices of the solid.
Answer:
The name of the solid is a pentagon.
Number of vertices = 5
Number of faces = 5
Numver of edges = 5
Write the word sentence as an equation.
Question 8.
17 plus a number q is 40.
Answer:
We have to write the equation for the word sentence.
The phrase ‘plus’ indicates ‘+’
17 + q = 40
Question 9.
The product of a number s and 14 is 49.
Answer:
We have to write the equation for the word sentence.
The phrase product indicates ‘×’
s × 14 = 49
Question 10.
The difference of a number b and 9 is 32.
Answer:
We have to write the equation for the word sentence.
The phrase difference indicates ‘-‘
b – 9 = 32
Question 11.
The quotient of 36 and a number g is 9.
Answer:
We have to write the equation for the word sentence.
The phrase quotient indicates ‘÷’
36 ÷ g = 9
Concepts, Skills, &Problem Solving
FINDING DISTANCES FROM THE MEAN Find the average distance of each data value in the set from the mean. (See Exploration 1, p. 439.)
Question 12.
Model years of used cars on a lot: 2014, 2006, 2009, 2011, 2005
Answer:
Question 13.
Prices of kites at a shop: $7, $20, $9, $35, $12, $15, $7, $10, $20, $25
Answer:
FINDING THE MEAN ABSOLUTE DEVIATION Find and interpret the mean absolute deviation of the data.
Question 14.
69, 51, 71, 77, 71, 80, 75, 63, 73
Answer:
Given the data
69, 51, 71, 77, 71, 80, 75, 63, 73
Number of samples = 9
Mean Absolute Deviation = 70
Question 15.
94, 86, 95, 99, 88, 90
Answer:
Given the data
94, 86, 95, 99, 88, 90
Number of samples = 6
Mean Absolute Deviation = 92
Question 16.
46, 54, 43, 57, 50, 62, 78, 42
Answer:
Given the data
46, 54, 43, 57, 50, 62, 78, 42
Number of samples = 8
Mean Absolute Deviation = 54
Question 17.
25, 28, 20, 22, 32, 28, 35, 34, 30, 36
Answer:
Given the data
25, 28, 20, 22, 32, 28, 35, 34, 30, 36
Number of samples = 10
Mean Absolute Deviation = 29
Question 18.
101, 115, 124, 125, 173, 165, 170
Answer:
Given the data
101, 115, 124, 125, 173, 165, 170
Number of samples = 7
Mean Absolute Deviation = 139
Question 19.
1.1, 7.5, 4.9, 0.4, 2.2, 3.3, 5.1
Answer:
Given the data
1.1, 7.5, 4.9, 0.4, 2.2, 3.3, 5.1
Number of samples = 7
Mean Absolute Deviation = 3.5
Question 20.
\(\frac{1}{4}, \frac{5}{8}, \frac{3}{8}, \frac{3}{4}, \frac{1}{2}\)
Answer:
Number of observations:5
Mean (x̄): 0.5
Mean Absolute Deviation (MAD): 0.15
Question 21.
4.6, 8.5, 7.2, 6.6, 5.1, 6.2, 8.1, 10.3
Answer:
Number of observations:8
Mean (x̄): 7.075
Mean Absolute Deviation (MAD): 1.45
Question 22.
YOU BE THE TEACHER
Your friend finds and interprets the mean absolute deviation of the data set 35, 40, 38, 32, 42, and 41. Is your friend correct? Explain your reasoning.
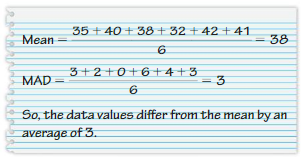
Answer:
x̄ = ∑x/n = (35 + 40 + 38)/3
= 113/3
= 37.6
Yes, the data values are different from the mean by an average of 3.
Question 23.
MODELING REAL LIFE
The data set shows the admission prices at several glass-blowing workshops.
$20, $20, $16, $12, $15, $25, $11
Find and interpret the range, interquartile range, and mean absolute deviation of the data.

Answer:
Range = (25 – 11)
= 14/2
= 7
Interquartile range:
Samples = 7
Xl = 12
Xu = 20
Xu – Xl = 20 – 12
= 8
Absolute Deviation of the data:
Data = 7
Mean = 17
Mean Absolute Deviation = 4
Question 24.
MODELING REAL LIFE
The table shows the prices of the five most-expensive and least-expensive dishes on a menu. Find the MAD of each data set. Then compare their variations.

Answer:
Five expensive dishes
$28, $30, $28, $39, $25
MAD:
Dishes = 5
Mean $30
MAD = $3.6
First leasr expensive dishes:
$7, $7, $10, $8, $12
MAD:
Dishes = 5
Mean $8.8
MAD = $1.76
Mean Absolute Deviation of five most expensive dishes is greater than Mean Absolute Deviation of five least expensive dishes.
Question 25.
REASONING
The data sets show the years of the coins in two collections.
Your collection: 1950, 1952, 1908, 1902, 1955, 1954, 1901, 1910
Your friend’s collection: 1929, 1935, 1928, 1930, 1925, 1932, 1933, 1920
Compare the measures of center and the measures of variation for each data set. What can you conclude?
Answer:
The measure of center is a value of the center or middle of a data set.
There are 4 measures of center they are
Mean
Median
Mode
Midrange
four measures of variations
Range
Interquartile range
Variance
Standard deviation
your collection:
Mean: (1950 + 1952 + 1908 + 1902 + 1955 + 1954 + 1901 + 1910)/8
= 1,929
Median: 1901, 1902, 1908, 1910, 1950, 1952, 1954, 1955
= (1910 + 1952)/2
= 1930
Mode: There is no mode
Midrange:
(1955 + 1901)/2
= 3856/2
= 1928
Range:
(1955 – 1901)/2
= 54/2
= 27
Interquartile range:
Number of observations = 8
Xl = 1903.5
Xu = 1953.5
Interquartile range = 50
Variance = 655.14
Standard deviation = 25.59
Question 26.
MODELING REAL LIFE
You survey students in your class about the numbers of movies they watched last month. A new student joins the class who watched 22 movies last month. Is22 an outlier? How does including this value affect the measures of center and the measures of variation? Explain.
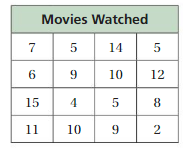
Answer:
REASONING
Which data set would have the greater mean absolute deviation? Explain your reasoning.
Question 27.
guesses for number of gumballs in a jar
guesses for number of baseballs in a jar
Answer:
Gumballs in the jar have a greater mean absolute deviation because baseballs are larger than baseballs.
Question 28.
monthly rainfall amounts in a city
monthly amounts of water used in a home
Answer:
Question 29.
REASONING
Range, interquartile range, and mean absolute deviation are all measures of variation. Which measure of variation is most reliable? Explain your reasoning.
Answer:
Question 30.
DIG DEEPER!
Add and subtract the MAD from the mean in the original data set in Exercise 26.
a. What percent of the values are within one MAD of the mean? two MADs of the mean? Which values are more than twice the MAD from the mean?
b. What do you notice as you get more and more MADs away from the mean? Explain.
Answer:
Statistical Measures Connecting Concepts
Using the Problem-Solving Plan
Question 1.
Six friends play a carnival game in which a person throws darts at balloons. Each person throws the same number of darts and then records the portion of the balloons that pop. Find and interpret the mean, median, and MAD of the data.
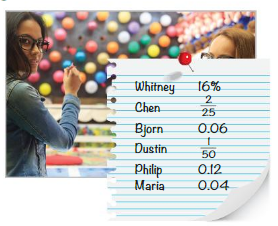
Understand the problem.
You know that each person throws the same number of darts. You are given the portion of balloons popped by each person as a fraction, a decimal, or a percent.
Make a plan.
First, write each fraction and each decimal as a percent. Next, order the percents from least to greatest. Then find and interpret the mean, median, and MAD of the data.
Solve and check.
Use the plan to solve the problem. Then check your solution.
Answer:
Question 2.
The cost c (in dollars) to rent skis at a resort for n days is represented by the equation c = 22n. The durations of several ski rentals are shown in the table. Find the range and interquartile range of the costs of the ski rentals. Then determine whether any of the costs are outliers.

Answer:
Given the equation c = 22n
c = 22(1) = 22
c = 22(5) = 1100
c = 22(1) = 22
c = 22(3) = 66
c = 22(5) = 110
c = 22(4) = 88
c = 22(3) = 66
c = 22(12) = 264
c = 22(1) = 22
c = 22(12) = 264
c = 22(5) = 110
c = 22(7) = 154
c = 22(4) = 88
c = 22(1) = 22
22, 110, 22, 66, 110, 88, 66, 264, 22, 264, 110, 154, 88, 22
Range = (264 – 22)/2 = 242/2
= 141
Interquartile range:
Number of observations: 14
lower quartile = 22
upper quartile = 121
Interquartile range = upper quartile – lower quartile
= 121 – 22
= 99
Performance Task
Which Measure of Center Is Best: Mean, Median, or Mode?
At the beginning of this chapter, you watched a STEAM Video called “Daylight in the Big City.“ You are now ready to complete the performance task related to this video, available at BigIdeasMath.com. Be sure to use the problem-solving plan as you work through the performance task.

Statistical Measures Chapter Review
Review Vocabulary
Write the definition and give an example of each vocabulary term.

Graphic Organizers
You can use a Definition and Example Chart to organize information about a concept. Here is an example of a Definition and Example Chart for the vocabulary term statistical question.
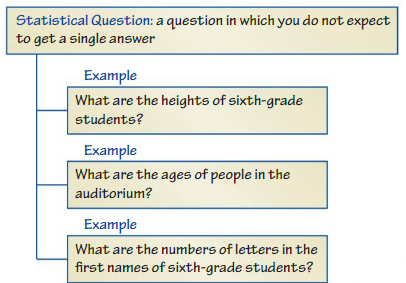
Choose and complete a graphic organizer to help you study the concept.

1. mean
2. outlier
3. median
4. mode
5. range
6. quartiles
7. interquartile range
Chapter Self-Assessment
As you complete the exercises, use the scale below to rate your understanding of the success criteria in your journal.

9.1 Introduction to Statistics (pp. 413–418)
Learning Target: Identify statistical questions and use data to answer statistical questions.
Determine whether the question is a statistical question. Explain.
Question 1.
How many positive integers are less than 20?
Answer: There are only 19 numbers in that group
Question 2.
In what month were the students in a sixth-grade class born?
Answer: February
Question 3.
The dot plot shows the number of televisions owned by each family on a city block.

a. Find and interpret the number of data values on the dot plot.
b. Write a statistical question that you can answer using the dot plot. Then answer the question.
Answer:
Display the data in a dot plot. Identify any clusters, peaks, or gaps in the data
Question 4.
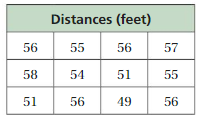
Answer:
Question 5.
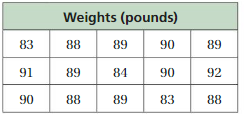
Answer:
Question 6.
You conduct a survey to answer, “What is the heart rate of a typical sixth-grade student?” e table shows the results. Use the distribution of the data to answer the question.
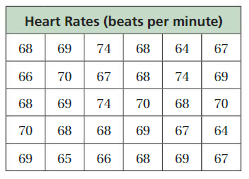
Answer:
9.2 Mean (pp. 419–424)
Learning Target: Find and interpret the mean of a data set.
Question 7.
Find the mean of the data.

Answer:
x̄ = ∑x/n =(1112+1409+675+536+1398+162)/6
x̄ = ∑x/n=6751/6
x̄ = ∑x/n=1125.16
Question 8.
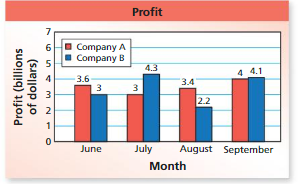
The double bar graph shows the monthly profit for two toy companies over a four-month period. Compare the mean monthly profits.
Answer:
Company A:
3.6, 3, 3.4, 4
Mean: (3.6 + 3 + 3.4 + 4)/4 = 14/4 = 3.5
Company B:
3, 4.3, 2.2, 4.1
Mean: (3 + 4.3 + 2.2 + 4.1)/4
= 13.6/4
= 3.4
Question 9.
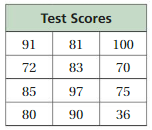
The table shows the test scores for a class of sixth-grade students. Describe how the outlier affects the mean. Then use the data to answer the statistical question, “What is the typical test score for a student in the class?”
Answer:
9.3 Measures of Center (pp. 425–432)
Learning Target: Find and interpret the median and mode of a data set.
Find the median and mode of the data.
Question 10.
8, 8, 6, 8, 4, 5, 6
Answer:
Median:
write the given data in ascending order or descending order.
4, 5, 6, 8, 8, 8
= (6 + 8)/2
= 14/2
= 7
Mode:
8 is the mode.
Question 11.
24, 74, 61, 29, 38, 27, 68, 54
Answer:
Median:
write the given data in ascending order or descending order.
24, 74, 61, 29, 38, 27, 68, 54
= 24, 27, 29, 38, 54, 61, 68, 74
= (38 + 54)/2
= 92/2
= 48
Mode:
There is no mode in the data.
Question 12.
Find the mean, median, and mode of the data set 67, 52, 50, 99, 66, 50, and 57 with and without the outlier. Which measure does the outlier affect the most?
Answer:
Given the data,
67, 52, 50, 99, 66, 50, and 57
Mean with outliner:
(67 + 52 + 50 + 99 + 66 + 50 + 57)/7
= 441/7
= 63
Mean without outliner:
66 is the median
Mode with outliner: 50
Mode without outliner:
No mode
Outliners affect the mean value of the data but have little effect on the median or mode of a given set of data.
Question 13.
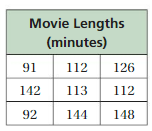
The table shows the lengths of several movies. Which measure of center best represents the data? Explain your reasoning.
Answer:
Question 14.
Give an example of a data set that does not have a median. Explain why the data set does not have a median.
Answer:
9.4 Measures of Variation (pp. 433–438)
Learning Target: Find and interpret the range and interquartile range of a data set.
Find the range of the data.
Question 15.
45, 76, 98, 21, 52, 39
Answer:
Lowest value = 21
Highest value = 98
Range = (98 – 21)/2
= 77/2
= 38.5
Question 16.
95, 63, 52, 8, 93, 16, 42, 37, 62
Answer:
Lowest value = 8
Highest value = 95
Range = (95 – 8)/2
= 87/2
= 43.5
Find the interquartile range of the data.
Question 17.
28, 46, 25, 76, 18, 25, 47, 83, 44
Answer:
Given the data
28, 46, 25, 76, 18, 25, 47, 83, 44
Number of observations: 9
lower quartile: 25
upper quartile: 61.5
Interquartile range (Xu – Xl) = 36.5
Question 18.
14, 25, 97, 55, 66, 28, 92, 38, 94
Answer:
Given the data
14, 25, 97, 55, 66, 28, 92, 38, 94
Number of observations: 9
lower quartile: 26.5
upper quartile: 93
Interquartile range (Xu – Xl) = 66.5
Question 19.
The table shows the weights of several adult emperor penguins. Find and interpret the range and interquartile range of the data. Then determine whether there are any outliers.
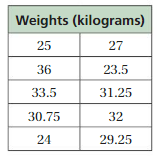
Answer:
25, 27, 36, 23.5, 33.5, 31.25, 30.75, 32, 24, 29.25
Yes there are outliner
Range: (36 – 25)/2
= 11/2
= 5.5
Interquartile range:
Number of observations = 10
Mean = 29.225
MAD = 3.98
Question 20.
Two data sets have the same interquartile range. Can you assume that the ranges of the two data sets are about the same? Give an example to justify your answer.
Answer:
23
Yes, a data set with the least value of 2 and the greatest value of 20 will have the same range as a data set with the least value of 82 and the greatest value of 100 will have the same range of 18.
9.5 Mean Absolute Deviation (pp. 439–444)
Learning Target: Find and interpret the mean absolute deviation of a data set.
Find and interpret the mean absolute deviation of the data.
Question 21.

Answer:
Given data,
6, 8.5, 6, 9, 10, 7, 8, 9.5
No. of observations: 8
Mean = 8
Mean Absolute Deviation: 1.25
Question 22.

Answer:
Given data,
130, 150, 190, 100, 175, 120, 165, 140, 180, 190
No. of observations: 10
Mean = 154
Mean Absolute Deviation: 26
Question 23.
The table shows the prices of the five most-expensive and least-expensive manicures given by a salon technician on a particular day. Find the MAD of each data set. Then compare their variations.

Answer:
five most-expensive:
$58, $52, $70, $49, $56
No. of observations: 5
Mean = 57
Mean Absolute Deviation: 5.6
5 least-expensive manicures:
$10, $10, $15, $10, $15
No. of observations: 5
Mean = 12
Mean Absolute Deviation: 2.4
The Mean Absolute Deviation of the five most-expensive is greater than the Mean Absolute Deviation of the 5 least-expensive manicures.
Question 24.
You record the lengths of songs you stream. The next song is 276 seconds long. Is 276 an outlier? How does including this value affect the measures of center and the measures of variation? Explain.
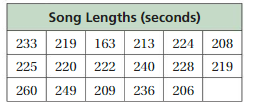
Answer:
Given the data,
233, 219, 163, 213, 224, 208, 225, 220, 222, 240, 228, 219, 260, 249, 209, 236, 206
The next song is 276 seconds long.
276 is the outliner.
We can remove 276 from the given data set.
So, there is no effect on the center and the measure of variations.
Statistical Measures Practice Test
Find the mean, median, mode, range, and interquartile range of the data.
Question 1.
5, 6, 4, 24, 10, 6, 9, 8
Answer:
Mean = (5 + 6 + 4 + 24 + 10 + 6 + 9 + 8)/8
= 72/8
= 9
Median:
4, 5, 6, 6, 8, 9, 10, 24
= (6 + 8)/2 = 14/2
= 7
Mode:
6 is the mode
range = (24 – 4)/2
= 20/2
= 10
Range:
Lowest value: 4
Highest value: 24
Range: 20
Interquartile range:
Lower quartile (xL): 5.25
Upper quartile (xU): 9.75
Interquartile range (xU-xL): 4.5
Question 2.
46, 27, 94, 56, 53, 65, 43
Answer:
Given the data,
46, 27, 94, 56, 53, 65, 43
Mean = (46 + 27 + 94 + 56 + 53 + 65 + 43)/7
= 16.75
Median = 15.5
Mode: There is no mode
Range:
Number of observations = 7
Lowest value: 27
Highest value: 94
Range: 67
Interquartile range:
Lower quartile (xL): 43
Upper quartile (xU): 65
Interquartile range (xU-xL): 22
Question 3.
32, 58, 19, 36, 44, 57, 11, 26, 74
Answer:
Given the data,
32, 58, 19, 36, 44, 57, 11, 26, 74
Mean = (32 + 58 + 19 + 36 + 44 + 57 + 11 + 26 + 74)/9
= 357/9
= 39.66
Median:
Arrange the data in ascending or descending order.
11, 19, 26, 32, 36, 44, 57, 58, 74
Median = 36
Mode: There is no mode in the data
Range:
Lowest value: 11
Highest value: 74
Range: 63
Interquartile range:
Lower quartile (xL): 22.5
Upper quartile (xU): 57.5
Interquartile range (xU-xL): 35
Question 4.
36, 24, 49, 32, 37, 28, 38, 40, 39
Answer:
Given the data
36, 24, 49, 32, 37, 28, 38, 40, 39
Arrange the data in ascending or descending order.
24, 28, 32, 36, 37, 38, 39, 40, 49
Mean = (24 + 28 + 32 + 36 + 37 + 28 + 38 + 40 + 49)/9
= 34.66
Median: 37
Mode: There is no mode
Range:
Lowest value: 24
Highest value: 49
Range: 25
Interquartile range:
Lower quartile (xL): 30
Upper quartile (xU): 39.5
Interquartile range (xU-xL): 9.5
Find and interpret the mean absolute deviation of the data.
Question 5.

Answer:
Given the data,
312, 286, 196, 201, 158, 225, 206, 192
Mean (x̄): 0.5
Mean Absolute Deviation (MAD): 0.15
Question 6.

Answer:
Given the data,
15, 8, 19, 20, 18, 20, 22, 14, 10, 15
Mean (x̄): 16.1
Mean Absolute Deviation (MAD): 3.7
Question 7.
You conduct a survey to answer, “How many Times (minutes)minutes does it take a typical sixth-grade student to run a mile?” The table shows the results. Use the distribution of the data to answer the question.
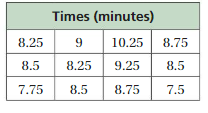
Answer:
Question 8.
The table shows the weights of Alaskan malamute 8181808281dogs at a veterinarian’s office. Which measure of center best represents the weight of an Alaskan malamute? Explain your reasoning.
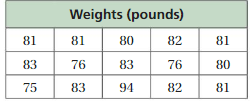
Answer:
Question 9.
The table shows the numbers of guests Numbers of Guests at a hotel on different days.

a. Find the range and interquartile range of the data.
b. Use the interquartile range to identify the outlier(s) in the data set. Find the range and interquartile range of the data set without the outlier(s). Which measure did the outlier or outliers affect more?
Answer:
Question 10.
The data sets show the numbers of hours worked each week by two people for several weeks.
Person A: 9, 18, 12, 6, 9, 21, 3, 12
Person B: 12, 18, 15, 16, 14, 12, 15, 18
Compare the measures of center and the measures of variation for each data set. What can you conclude?
Answer:
Question 11.
The table shows the lengths of several bearded dragons captured for a study. Find the mean, median, and mode of the data in centimeters and in inches. How does converting to inches affect the mean, median, and mode?
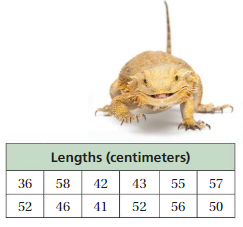
Answer:
Statistical Measures Cumulative Practice
Question 1.
Which statement can be represented by a negative integer?
A. The temperature rises 15 degrees.
B. A hot-air balloon ascends 450 yards.
C. You earn $50 completing chores.
D. A submarine submerges 260 feet.
Answer: D. A submarine submerges 260 feet.
Question 2.
What is the height h (in inches) of the prism?
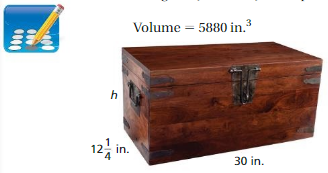
Answer:
h = v/lw
h = 5850/30(12 1/4)
h = 5850/(30 × 12.25)
h = 5850/367.50
h = 15.91 inches
Question 3.
Which is the solution of the inequality \(\frac{2}{3}\)x < 6?
F. x < 4
G. x < 5\(\frac{1}{3}\)
H. x < 6\(\frac{2}{3}\)
I. x < 9
Answer: I. x < 9
Question 4.
The number of hours that each of six students spent reading last week is shown in the bar graph.
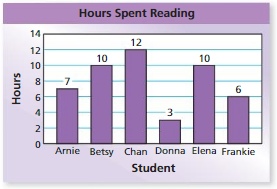
For the data in the bar graph, which measure is the?
A. mean
B. median
C. mode
D. range
Answer: C. mode
Explanation:
In the above bar graph, 10 is repeated two ways.
Thus the correct answer is option C.
Question 5.
Which list of numbers is in order from least to greatest?
F. – 5.41, – 3.6, – 3.2, – 3.06, – 1
G. – 1, – 3.06, – 3.2, – 3.6, – 5.41
H. – 5.41, – 3.06, – 3.2, – 3.6, – 1
I. – 1, – 3.6, – 3.2, – 3.06, – 5.41
Answer: F. – 5.41, – 3.6, – 3.2, – 3.06, – 1
Explanation:
We have to write the numbers from least to greatest
The negative sign with the highest number will be the least.
– 5.41, – 3.6, – 3.2, – 3.06, – 1
Thus the correct answer is option F.
Question 6.
What is the mean absolute deviation of the data shown in the dot plot, rounded to the nearest tenth?
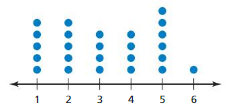
A. 1.4
B. 3
C. 3.2
D. 57.
Answer:
Data from the dot plot
5, 5, 4, 4, 6, 1
Number of observations: 6
Mean = 4.166
Mean absolute deviation = 1.66
Thus the correct answer is option A.
Question 7.
A family wants to buy tickets to a theme park. There are separate ticket prices for adults and children.

Which expression represents the total cost (in dollars) for adult tickets c and child tickets?
F. 600 (a + c)
G. 50(a × c)
H. 30a + 20c
I. 30a × 20c
Answer: H. 30a + 20c
Question 8.
The dot plot shows the leap distances (in feet) of a tree frog. How many leaps were recorded?

Answer: 7 leaps were recorded
Question 9.
What is the value of the expression when a = 6 and b = 14?
0.8a + 0.02b
A. 0.4828
B. 0.8814
C. 5.08
D. 16.4
Answer:
Given the expression,
0.8a + 0.02b
a = 6
b = 14
0.8(6) + 0.02(14)
4.8 + 0.28
= 5.08
Thus the correct answer is option C.
Question 10.
Which property was not used to simplify the expression?
F. Distributive Property
G. Associative Property of Addition
H. Multiplication Property of One
I. Commutative Property of Multiplication
Answer: I. Commutative Property of Multiplication
Question 11.
What are the coordinates of Point P?
A. (- 3, – 2)
B. (3, – 2)
C. (- 2, – 3)
D. (-2, 3)
Answer: B. (3, – 2)
Explanation:
By seeing the above graph we can write the ordered pair P.
the x-axis is on 3 and the y-axis is on -2
Thus the correct answer is option B.
Question 12.
Create a data set with 5 numbers that has the following measures.
Think
Solve
Explain
• a mean of 7
• a median of 9
Explain how you created your data set.
Answer:
The data set is 3, 2, 9, 1, 20
Final Words:
I hope the article regarding the Big Ideas Math Answers Grade 6 Chapter 9 Statistical Measures is helpful for the students who are lagging in this concept. Feel free to post the comments if you have any doubts regarding the methods or answers. We will try to clarify your doubts as early as possible.