Go Math Grade 7 Answer Key Chapter 12 Experimental Probability helps the students to score best in the examinations. Download Go Math Answer Key Chapter 12 Experimental Probability for free. We provide a detailed explanation for all the questions which makes students understand the concepts in an easy manner. Students feel that probability is difficult among all the chapters but it is an interesting and easy chapter. Refer Go Math Grade 7 Answer Key Chapter 12 Experimental Probability while doing your homework.
Go Math Grade 7 Answer Key Chapter 12 Experimental Probability
Below we have provided the links according to the list of the chapters. Get the solutions for all Guided Practice and Independent Practice. Just tap the links and get the answers in Go Math Grade 7 Answer Key Chapter 12 Experimental Probability. Improve your math skills with the help of HMH Go Math Grade 7 Solution Key Chapter 12 Experimental Probability.
Chapter 12– Lesson 1:
Chapter 12– Lesson 2:
Chapter 12– Lesson 3:
Chapter 12– Lesson 4:
- Guided Practice – Page No. 390
- Independent Practice – Page No. 391
- Page No. 392
- 12.1 Probability – Page No. 393
- Selected Response – Page No. 394
Guided Practice – Page No. 372
Determine whether each event is impossible, unlikely, as likely as not, likely, or certain. Then, tell whether the probability is 0, close to 0, \(\frac{1}{2}\) , close to 1, or 1.
Question 2.
randomly picking a green card from a standard deck of playing cards
_____
Answer: Probability is 0.
Explanation: A standard deck of play cards does not have green cards, so the probability is 0.
Question 3.
randomly picking a red card from a standard deck of playing cards
_____
Answer: Probability is 1/2.
Explanation: As half of the cards are from a standard deck of playing cards are red, so the probability is 1/2.
Question 4.
picking a number less than 15 from a jar with papers labeled from 1 to 12
_____
Answer: The probability of picking a number less than 15 is 1.
Explanation: All papers have a number less than 15, so the probability of picking a number less than 15 is 1.
Question 5.
picking a number that is divisible by 5 from a jar with papers labeled from 1 to 12
close to _____
Answer: The probability is 1/6.
Explanation: The numbers divisible by 5 from 1 to 12 are 5 and 10, so there are two positive numbers from a total of 12 positive numbers and the probability of picking a number that is divisible by 5 is 2/12= 1/6.
Find each probability. Write your answer in simplest form.
Question 6.
spinning a spinner that has 5 equal sections marked 1 through 5 and landing on an even number
\(\frac{□}{□}\)
Answer: The spinner landing on an even number is 2/5.
Explanation: As there are 5 possible outcomes when spinning the spinner and there are two even numbers on the spinner 2 and 4. So the probability of the spinner landing on an even number is 2/5.
Question 7.
picking a diamond from a standard deck of playing cards which has 13 cards in each of four suits: spades, hearts, diamonds and clubs
\(\frac{□}{□}\)
Answer: The probability is 1/4.
Explanation: As the dek of cards contains 52 cards. so there are 52 possible outcomes in the situation and there are 13 cards with diamonds. So the probability is 13/52= 1/4.
Use the complement to find each probability.
Question 8.
What is the probability of not rolling a 5 on a standard number cube?
\(\frac{□}{□}\)
Answer: The probability of not rolling a 5 is 5/6.
Explanation: A standard number cube has six sides and marked from 1 to 6, so the probability of rolling a 5 is 1/6. And the probability of not rolling a 5 is
P(rolling a 5) + P(not rolling a 5 ) = 1
1/6 + P(not rolling a 5 )= 1
P(not rolling a 5 ) = 1- 1/6
= (6-1)/6
= 5/6.
Question 9.
A spinner has 3 equal sections that are red, white, and blue. What is the probability of not landing on blue?
\(\frac{□}{□}\)
Answer: The probability of not landing on blue is 2/3.
Explanation: As spinner has 3 equal sections, so possible outcomes are 3. The probability of landing on blue is 1/3, so the probability of not landing on blue is
P(landing on blue) + P(not landing on blue ) = 1
1/3 + P(not landing on blue )= 1
P(not landing on blue ) = 1- 1/3
= (3-1)/3
= 2/3.
Question 10.
A spinner has 5 equal sections marked 1 through 5. What is the probability of not landing on 4?
\(\frac{□}{□}\)
Answer:
Explanation: As spinner has 5 equal sections, so possible outcomes are 5. The probability of landing on 4 is 1/5, so the probability of not landing on 4 is
P(landing on 4) + P(not landing on 4 ) = 1
1/5 + P(not landing on blue )= 1
P(not landing on blue ) = 1- 1/5
= (5-1)/5
= 4/5.
Question 11.
There are 4 queens in a standard deck of 52 cards. You pick one card at random. What is the probability of not picking a queen?
\(\frac{□}{□}\)
Answer: The probability of not picking a queen is 12/13.
Explanation: The deck has 52 cards, so there are 52 possible outcomes. And there are 4 queens in the deck, so the probability of picking a queen is 4/52= 1/13. And the probability of not picking a queen is
P(picking queen) + P(not picking queen ) = 1
1/13 + P(not picking queen )= 1
P(not picking queen ) = 1- 1/13
= (13-1)/13
= 12/13.
Essential Question Check-In
Question 12.
Describe an event that has a probability of 0% and an event that has a probability of 100%.
Answer: An event with a probability of 0% would be picking a number card labeled 15 from a standard deck of cards. And an event with a probability of 100% would be picking a red marble from a bowl filled only with red marbles.
Independent Practice – Page No. 373
Question 13.
There are 4 aces and 4 kings in a standard deck of 52 cards. You pick one card at random. What is the probability of selecting an ace or a king? Explain your reasoning.
\(\frac{□}{□}\)
Answer: The probability of selecting an ace or king from the deck is 2/13.
Explanation: There are 52 possible outcomes when picking from a deck of cards and there are 8 cards that have an ace or king, so the probability of selecting an ace or king from the deck is 8/52= 2/13.
Question 14.
There are 12 pieces of fruit in a bowl. Seven of the pieces are apples and two are peaches. What is the probability that a randomly selected piece of fruit will not be an apple or a peach? Justify your answer.
\(\frac{□}{□}\)
Answer: The probability of not picking an apple or a peach is 1/4.
Explanation: There are 12 possible outcomes and 9 out of 12 fruits are apples or peaches, so the probability of picking an apple or a peach is 9/12 = 3/4. And the probability of not picking an apple or a peach is
P(picking an apple or a peach ) + P(not picking an apple or a peach ) = 1
3/4 + P(not picking an apple or a peach)= 1
P(not picking an apple or a peach) = 1- 3/4
= (4-3)/4
= 1/4.
Question 15.
Critique Reasoning
For breakfast, Clarissa can choose from oatmeal, cereal, French toast, or scrambled eggs. She thinks that if she selects a breakfast at random, it is likely that it will be oatmeal. Is she correct? Explain your reasoning.
_____
Answer: Clarissa will unlikely to have oatmeal.
Explanation: As Clarissa has 4 breakfast choices, the probability of choosing oatmeal is 1/4, so it is unlikely that Clarissa will have oatmeal.
Question 16.
Draw Conclusions
A researcher’s garden contains 90 sweet pea plants, which have either white or purple flowers. About 70 of the plants have purple flowers, and about 20 have white flowers. Would you expect that one plant randomly selected from the garden will have purple or white flowers? Explain.
_____
Answer: The one plant randomly selected from the garden will be pruple flowers.
Explanation: The probability of selecting a white flowered plant is 20/90= 2/9 and the probability of selecting purple flowered plant is 70/90= 7/9. So, it is more likely to select a purple plant when randomly choosing from the garden
Question 17.
The power goes out as Sandra is trying to get dressed. If she has 4 white T-shirts and 10 colored T-shirts in her drawer, is it likely that she will pick a colored T-shirt in the dark? What is the probability she will pick a colored T-shirt? Explain your answers.
_____
Answer: The probability of selecting a colored T-shirt is 5/7.
Explanation: The total number of T-shirts in Sandra’s drawer are 14, and the probability of selecting a white T-shirt is 4/14= 2/7. And the probability of selecting a colored T-shirt is 10/14= 5/7. So, it is more likely to choose a colored T-shirt when randomly choosing from the drawer.
Page No. 374
Question 18.
James counts the hair colors of the 22 people in his class, including himself. He finds that there are 4 people with blonde hair, 8 people with brown hair, and 10 people with black hair. What is the probability that a randomly chosen student in the class does not have red hair? Explain.
_____
Answer: The probability that a randomly chosen student in the class does not have red hair is 1.
Explanation: As there is no student with red hair in James class and that means the probability that a randomly chosen student in the class does not have red hair is 1.
Question 19.
Persevere in Problem Solving
A bag contains 8 blue coins and 6 red coins. A coin is removed at random and replaced by three of the other color.
a. What is the probability that the removed coin is blue?
\(\frac{□}{□}\)
Answer: The probability that the blue coin is removed is 8/14= 4/7.
Explanation: The total number of coins in the bag is 14, so there are 14 possible outcomes. As there are 8 blue coins and 6 red coins, so the probability that the blue coin is removed is 8/14= 4/7.
Question 19.
b. If the coin removed is blue, what is the probability of drawing a red coin after three red coins are put in the bag to replace the blue one?
\(\frac{□}{□}\)
Answer: The probability of choosing a red coin is 9/16.
Explanation: The total number of coins in the bag is 14 and one blue coin was removed which means 8-1= 7 and three red coins are added, so 6+3= 9 the total number of coins is 7+9= 16. And there are 7 blue coins and 9 red coins, so the probability of choosing a red coin is 9/16.
Question 19.
c. If the coin removed is red, what is the probability of drawing a red coin after three blue coins are put in the bag to replace the red one?
\(\frac{□}{□}\)
Answer: The probability of choosing a red coin is 5/16.
Explanation: The total number of coins in the bag is 14 and one red coin was removed which means 6-1= 5 and three blue coins are added, so 8+3= 11 the total number of coins is 5+11= 16. And there are 11 blue coins and 5 red coins, so the probability of choosing a red coin is 5/16.
H.O.T.
Focus on Higher Order Thinking
Question 20.
Draw Conclusions
Give an example of an event in which all of the outcomes are not equally likely. Explain.
Answer: A bag of coins with 5 red coins and 11 blue coins are not equally likely.
Explanation: All the outcomes are not equally likely would be having a bag of coins with 5 red coins and 11 blue coins. Since these are not the same number of coins of each color, so the probability of choosing a certain color are not equal.
Question 21.
Critique Reasoning
A box contains 150 black pens and 50 red pens. Jose said the sum of the probability that a randomly selected pen will not be black and the probability that the pen will not be red is 1. Explain whether you agree.
Answer: Jose is correct and the probability of choosing a pen that is not black and the probability of choosing the pen that is not red is 1.
Explanation: Since the pens are either red or black, the probability of choosing a pen that is not black is equal to the probability of choosing a pen that is red and the probability of choosing a pen that is not red is equal to the probability of choosing a pen that is black. So the probability of choosing a pen that is not black and the probability of choosing the pen that is not red is
P(not red)+P(not black)= 150/200 + 50/200
= 200/200
= 1.
Question 22.
Communicate Mathematical Ideas
A spinner has 7 identical sections. Two sections are blue, 1 is red, and 4 of the sections are green. Suppose the probability of an event happening is \(\frac{2}{7}\). What does each number in the ratio represent? What outcome matches this probability?
Answer: The probability outcome match is 2/7.
Explanation: As the spinner has 7 identical sections. The numerator of the ratio represents the number of sections with color and the denominator represents the total number of sections on the spinner. And there are 2 blue sections, so the probability of the spinner landing on the blue is 2/7 matches.
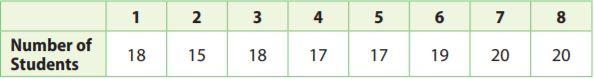
Guided Practice – Page No. 378
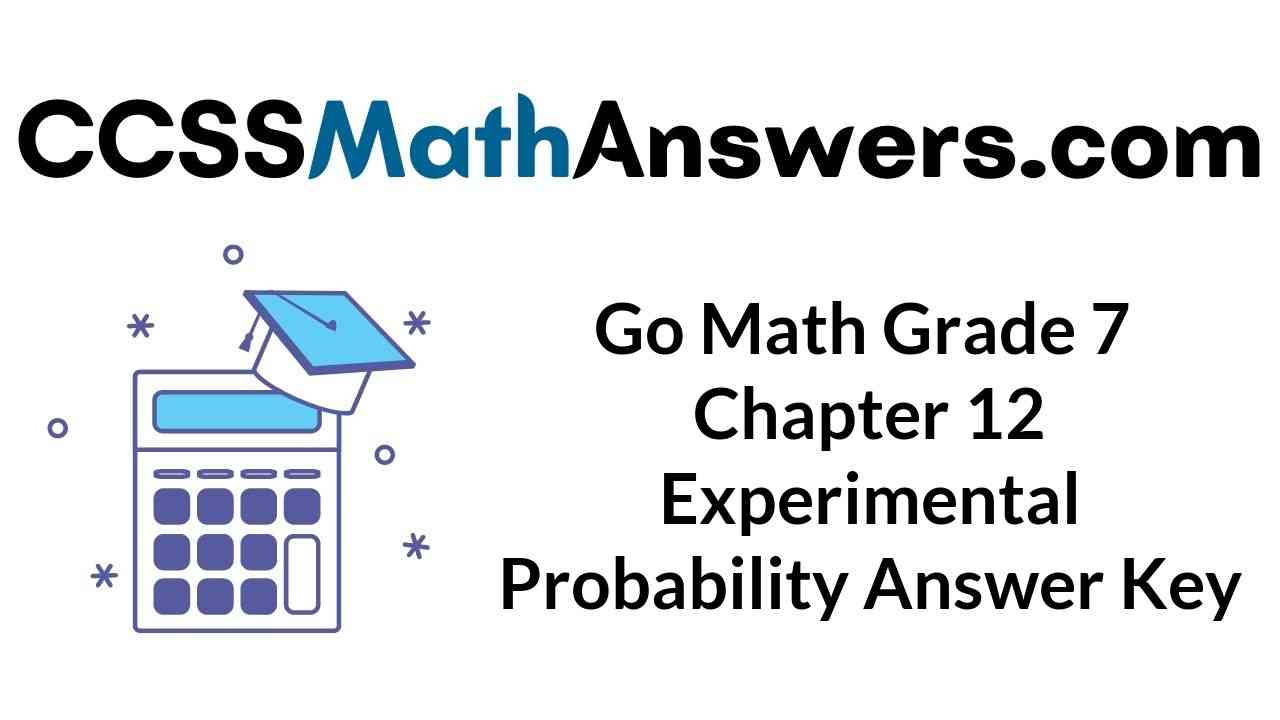
Question 1.
A spinner has four sections lettered A, B, C, and D. The table shows the results of several spins. Find the experimental probability of spinning each letter as a fraction in simplest form, a decimal, and a percent.
Answer:
The probability of letter A is 35%.
The probability of letter B is 17.5%.
The probability of letter C is 27.5%.
The probability of letter D is 20%.
Explanation:
The total number of spins is 14+7+11+8= 40.
The probability for the letter A is 14/40= 7/20
= 0.35
= 35%.
The probability for the letter B is 7/40= 0.175
= 17.5%.
The probability for the letter C is 11/40= 0.275
= 27.5%.
The probability for the letter D is 8/40= 1/5
= 0.2
= 20%.
Question 2.
Rachel’s free-throw average for basketball is 60%. She wants to predict how many times in the next 50 tries she will make a free throw. Describe how she could use 10 index cards to predict the answer.
Answer: As Rachel has a 60% success rate, she could write Successful on 6 cards and Unsuccesful on 4 cards. She then needs to draw cards at random 50 times and record the number of times she gets a Succesful card.
Essential Question Check-In
Question 3.
Essential Question Follow Up
How do you find an experimental probability of a simple event?
Answer: To find the experimental probability of a simple event, divide the number of successful outcomes by the total number of outcomes in the experiment.
Explanation: To find the experimental probability of a simple event, divide the number of successful outcomes by the total number of outcomes in the experiment. For example, if a person makes 10 free throws out of 18, attempts, the experimental probability of making the next free throw is 10/18 = 5/9.
Independent Practice – Page No. 379
Question 4.
Dree rolls a strike in 6 out of the 10 frames of bowling. What is the experimental probability that Dree will roll a strike in the first frame of the next game? Explain why a number cube would not be a good way to simulate this situation.
\(\frac{□}{□}\)
Answer: The experimental probability is 6/10 = 3/5. And the number of possible outcomes should be a multiple of 5.
Experiment:
The experimental probability is 6/10 = 3/5. As the denominator of the probability is either 5 or 10, a number cube would not be able to represent the outcomes because it has 6 faces.
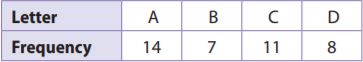
Question 5.
To play a game, you spin a spinner like the one shown. You win if the arrow lands in one of the areas marked “WIN”. Lee played this game many times and recorded her results. She won 8 times and lost 40 times. Use Lee’s data to explain how to find the experimental probability of winning this game.
\(\frac{□}{□}\)
Answer: The experimental probability is 8/48= 1/6.
Explanation: As Lee won 8 times and lost 40 times, the number of spins that Lee played is 8+40= 48. So the experimental probability is 8/48= 1/6.
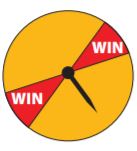
Question 6.
The names of the students in Mr. Hayes’ math class are written on the board. Mr. Hayes writes each name on an index card and shuffles the cards. Each day he randomly draws a card, and the chosen student explains a math problem at the board. What is the probability that Ryan is chosen today? What is the probability that Ryan is not chosen today?
Chosen: \(\frac{□}{□}\)
Answer: The probability of the teacher not choosing Ryan is 19/20.
Explanation: As there are 20 students, so possible outcomes are 20. And Ryan is 1 student, the probability of the teacher choosing Ryan is 1/20. And the probability of the teacher not choosing Ryan is
= 1- 1/20
= (20-1)/20
= 19/20.
Question 7.
Critique Reasoning
A meteorologist reports an 80% chance of precipitation. Is this an example of experimental probability, written as a percent? Explain your reasoning.
______
Answer: Yes, the given example is the experimental probability.
Explanation: Experimental probability uses past data to predict future data. The probability that it will rain is based on historical data. So it is an experimental probability written as a percent.
Page No. 380
Question 8.
Mica and Joan are on the same softball team. Mica got 8 hits out of 48 times at bat, while Joan got 12 hits out of 40 times at bat. Who do you think is more likely to get a hit her next time at bat? Explain.
______
Answer: Joan is more likely to get hit her next time at the bat.
Explanation:
As Mica got 8 hits out of 48 times, so the experimental probability of getting a hit is 8/48= 1/6.
And Joan got 12 hits out of 40 times, the experimental probability of getting a hit is 12/40= 3/10.
Therefore Joan is more likely to get hit her next time at the bat.
Question 9.
Make a Prediction
In tennis, Gabby serves an ace, a ball that can’t be returned, 4 out of the 10 times she serves. What is the experimental probability that Gabby will serve an ace in the first match of the next game? Make a prediction about how many aces Gabby will have for the next 40 serves. Justify your reasoning.
\(\frac{□}{□}\)
Answer: The experimental probability of her serving an ace is 2/5. In 40 serves, she will serve an ace about 2/5×40 = 16 times.
Explanation: To find the experimental probability we need to divide the number of tries by the number of aces. As Gabby serves 4 aces out of 10 times, the experimental probability of her serving an ace is 4/10= 2/5. Next, to make a prediction about how many aces Gabby will have for the next 40 serves, we need to multiply the number of servers 40 by the experimental probability. In her next 40 serves, she will serve an ace about 2/5×40 = 16 times.
Question 10.
Represent Real-World Problems
Patricia finds that the experimental probability that her dog will want to go outside between 4 P.M. and 5 P.M. is \(\frac{7}{12}\). About what percent of the time does her dog not want to go out between 4 P.M. and 5 P.M.?
______ %
Answer: 41.67%
Explanation: As the sum of the probabilities of an event and its complement is always equal to 1 and P(dog want to go outside) is \(\frac{7}{12}\).
So P(dog want to go outside)+P(dog does not want to go outside) = 1
\(\frac{7}{12}\) + P(dog does not want to go outside) = 1
P(dog does not want to go outside) = 1-\(\frac{7}{12}\)
= \(\frac{12-7}{12}\)
= \(\frac{5}{12}\)
= 0.4167
= 41.67%
H.O.T.
Focus on Higher Order Thinking
Question 11.
Explain the Error
Talia tossed a penny many times. She got 40 heads and 60 tails. She said the experimental probability of getting heads was \(\frac{40}{60}\). Explain and correct her error.
Answer: Talia is not correct.
Explanation: As Taila got 40 heads and 60 tails, which means that she did 100 tosses of the coin. So the experimental probability of getting heads was \(\frac{40}{100}\)
Question 12.
Communicate Mathematical Ideas
A high school has 438 students, with about the same number of males as females. Describe a simulation to predict how many of the first 50 students who leave school at the end of the day are female.
Answer: Since high school has about the same number of male students as female students, the probability of a student leaving school at the end of the day being female is about 50%. And a possible simulation could be using a coin toss, with heads representing males and tails representing females. Toss the coin 50 times and use the results to make a prediction.
Question 13.
Critical Thinking
For a scavenger hunt, Chessa put one coin in each of 10 small boxes. Four coins are quarters, 4 are dimes, and 2 are nickels. How could you simulate choosing one box at random? Would you use the same simulation if you planned to put these coins in your pocket and choose one? Explain your reasoning.
Answer: A possible simulation could be using 10 index cards. Four of the cards could be labeled as quarters, four as dimes, and two nickels. Then cards can be drawn and recorded to simulate choosing a box at random. This simulation could not be used if you planned to put these coins in your pocket and choose one. This is because the size of the coins vary. As we would be able to tell what coin it was in the pocket by feeling its size. And picking one of out your pocket is different than picking a box out of 10 boxes of the same size.
Guided Practice – Page No. 384
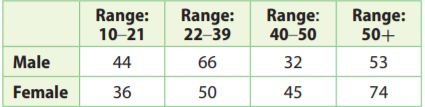
Question 1.
A dentist has 400 male and female patients that range in ages from 10 years old to 50 years old and up as shown in the table. What is the experimental probability that the next patient will be female and in the age range 22–39?
\(\frac{□}{□}\)
Answer: The experimental probability is \(\frac{1}{8}\)
Explanation: The total male and female patients are 400.
The age range 22-39 is 50 females
The experimental probability is \(\frac{50}{400}\)
= \(\frac{1}{8}\).
Question 2.
At a car wash, customers can choose the type of wash and whether to use the interior vacuum. Customers are equally likely to choose each type of wash and whether to use the vacuum. Use a simulation to find the experimental probability that the next customer purchases a deluxe wash and no interior vacuum. Describe your simulation.
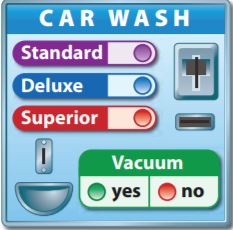
Answer: The experimental probability is \(\frac{11}{50}\).
Explanation: A possible simulation could be using a standard cube and flipping a coin. If the number cube rolls 1 or 2 it is recorded as a standard wash, if the number cube rolls 3 or 4 it is recorded as a deluxe wash, if the number cube rolls 5 or 6 it is recorded as a superior wash. For the coin toss, heads count as vacuum and tails count as no vacuum.
For example:
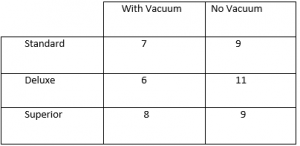
So the experimental probability that the next customer purchases a deluxe and no interior vacuum is \(\frac{11}{50}\).
Essential Question Check-In
Question 3.
How do you find the experimental probability of a compound event?
Answer: To find the experimental probability of a compound event, determine the number of occurrences that satisfies both events and then divide it by the total number of trails.
Independent Practice – Page No. 385
Question 4.
Represent Real-World Problems
For the same food trailer mentioned in Example 1, explain how to find the experimental probability that the next order is two pieces of chicken with a green salad.
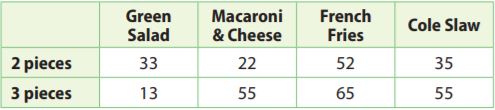
\(\frac{□}{□}\)
Answer: The experimental probability is \(\frac{1}{10}\).
Explanation: The total number of orders is 330 and in that 33 orders are with 2 pieces green salad, so the experimental probability is
P(2 pieces + green salad) = \(\frac{33}{330}\)
= \(\frac{1}{10}\).
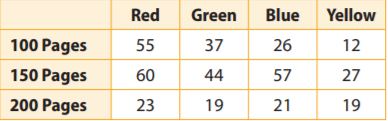
The school store sells spiral notebooks in four colors and three different sizes. The table shows the sales by size and color for 400 notebooks.
Question 5.
What is the experimental probability that the next customer buys a red notebook with 150 pages?
\(\frac{□}{□}\)
Answer: The experimental probability is \(\frac{3}{20}\).
Experiment: The total number of notebooks sold is 400 and in that, red notebooks with 150 pages sold are 60.
So the experimental probability is \(\frac{60}{400}\)
= \(\frac{3}{20}\).
Question 6.
What is the experimental probability that the next customer buys any red notebooks?
\(\frac{□}{□}\)
Answer: The experimental probability is \(\frac{69}{200}\).
Explanation: The total number of notebooks sold is 400 and in that, red notebooks sold are 138.
So the experimental probability that the next customer buys any red notebooks is \(\frac{138}{400}\)
= \(\frac{69}{200}\).
Question 7.
Analyze Relationships
How many possible combined page count and color choices are possible? How does this number relate to the number of page size choices and to the number of color choices?
Answer: 12 is the product of the number of page size choices and the number of color choices.
Explanation: As there are 12 entries in the table, there are 12 possible page count and color combinations. This number relates to the number of page size choices and to the number of color choices by the fact that there are 3-page count choices and 4 colors.
So 3×4= 12.
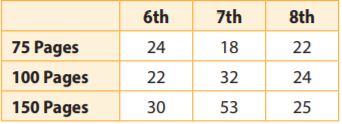
A middle school English teacher polled random students about how many pages of a book they read per week.
Question 8.
Critique Reasoning
Jennie says the experimental probability that a 7th grade student reads at least 100 pages per week is \(\frac{16}{125}\). What is her error and the correct experimental probability?
\(\frac{□}{□}\)
Answer: The correct experimental probability \(\frac{17}{50}\).
Explanation:
The total number of students is 24+22+30+18+32+53+22+24+25= 250. And the total number of 7th graders that reads at least 100 pages is 32+53= 85. Jennie’s error not including the 7th-grade students that read 150 pages a week. So the experimental probability is
P(7th grade+ al least 100 pages)= \(\frac{85}{250}\)
= \(\frac{17}{50}\).
Question 9.
Analyze Relationships
Based on the data, which group(s) of students should be encouraged to read more? Explain your reasoning.
Answer: 6th and 8th grade should be encouraged to read more.
Explanation: Based on the data, 6th and 8th grade should be encouraged to read more as 6th and 8th grades read 150 pages per week than 7th grade.
H.O.T. – Page No. 386
Focus on Higher Order Thinking
Question 10.
Make a Conjecture
Would you expect the probability for the simple event “rolling a 6” to be greater than or less than the probability of the compound event “rolling a 6 and getting heads on a coin”? Explain.
Answer: Rolling a 6 to be greater than the probability of the compound event.
Explanation: The simple event would have a greater probability than the probability of the compound event. Because to find a compound event you have to multiply the two probabilities in fraction form. Multiplying two fractions that are less than 1 gives a fraction answer that is smaller than the original two fractions. The probability for the simple event of rolling a 6 is 1/6. The probability of the compound event is 1/6×1/2= 1/12 < 1/6.
Question 11.
Critique Reasoning
Donald says he uses a standard number cube for simulations that involve 2, 3, or 6 equal outcomes. Explain how Donald can do this.
Answer:
If a simulation has two options A and B, Donald can let the even number be A and the odd number be B. If a stimulation has 3 outcomes A, Band C Donald can let 1 and 2 be A, 3 and 4 be B, and 5 and 6 be C. If a stimulation has 6 outcomes A, B, C, D, E, and F Donald can let 1 be A 2 be B, 3 be C 4 be D 5 be E, and 6 be F
Question 12.
Draw Conclusions
Data collected in a mall recorded the shoe styles worn by 150 male and for 150 female customers. What is the probability that the next customer is male and has an open-toe shoe (such as a sandal)? What is the probability that the next male customer has an open-toe shoe? Are the two probabilities the same? Explain.
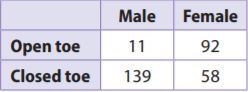
Answer: The probability of the next customer is male and has an open-toe shoe is 11/300. And the probability of male customers having open-toe shoes is 11/150.
Explanation:
The total number of customers is 300 and 11 male customers are with open-toe shoes. So the probability of the next customer is male and has an open-toe shoe is 11/300. And the probability of male customers having open-toe shoes is 11/150. The probabilities are not the same, the first one being a compound event and the second one being a simple event.
Question 13.
What If?
Suppose you wanted to perform a simulation to model the shoe style data shown in the table. Could you use two coins? Explain.
______
Answer: No, two coins cannot be used.
Explanation: No, coins cannot be used for this simulation. As there are two options male and female, for the type of customers and two options open and close toe for the type of shoe. It is not given that the customers are equally likely to wear each kind of shoe. So a coin can only be used to simulate male or female.
Question 14.
Represent Real-World Problems
A middle school is made up of grades 6, 7, and 8, and has about the same number of male and female students in each grade. Explain how to use a simulation to find the experimental probability that the first 50 students who arrive at school are male and 7th graders.
Answer: A possible simulation could be done using a coin to simulate a male or female and a standard number of the cube to simulate a grade. Let tails be the male and heads be the female. 1 and 2 be 6th grade, 3 and 4 be 7th grade, and 5 and 6 be the 8th grade. After flipping the coin and rolling the number cube 50 times and recording the results each time and count the number of times you got male and 7th grade out of 50 trails.
Guided Practice – Page No. 390
Question 1.
A baseball player reaches first base 30% of the times he is at bat. Out of 50 times at bat, about how many times will the player reach first base?
______
Answer: So 15 times will the player reach the first base.
Explanation: As the baseball player reaches first base at 30% out of 50 times at bat, so
30% of 50= 0.3×50
= 15.
So 15 times will the player reach the first base.
Question 2.
The experimental probability that it will rain on any given day in Houston, Texas, is about 15%. Out of 365 days, about how many days can residents predict rain?
______
Answer: 55 days can residents predict rain.
Explanation: As the experimental probability that it will rain is 15% out of 365 days, so
15% of 365= 0.15×365
= 54.75
= 55 days.
So 55 days can residents predict rain.
Question 3.
A catalog store has 6% of its orders returned for a refund. The owner predicts that a new candle will have 812 returns out of the 16,824 sold. Do you agree with this prediction? Explain.
______
Answer: The prediction is incorrect.
Explanation: As the catalog store has 6% of its order and 16,824 are sold, so
6% of 16,824 = 0.06×16,824
= 1009 will return.
As the owner predicts that a new candle will have an 812 return which is less than 1009, so the prediction is incorrect.
Question 4.
On a toy assembly line, 3% of the toys are found to be defective. The quality control officer predicts that 872 toys will be found defective out of 24,850 toys made. Do you agree with this prediction? Explain.
______
Answer: The prediction is incorrect.
Explanation: As 3% are found defective out of 24,850 toys, so
3% of 24,850 = 0.03×24850
= 746 will be defective.
As the quality control officer predicts that 872 toys will be found defective which is greater than 746, so the prediction is incorrect.
Question 5.
A light-rail service claims to be on time 98% of the time. Jeanette takes the light-rail 40 times one month, how many times can she predict she will be on time? Is the light-rail’s claim accurate if she is late 6 times?
______
Answer: Jeanette will be on time about 39 times.
Explanation: As light-rail service claims to be on time 98%, and Jeanette takes the light-rail 40 times one month. So
98% of 40= 0.98×40
= 39.
So Jeanette will be on time about 39 times. if she is late 6 times, then the claim is not accurate. Being late 6 times means she was on-time 34 times and \(\frac{34}{40}\)= 85% which is not close to 98%.
Question 6.
On average, a college claims to accept 18% of its applicants. If the college has 5,000 applicants, predict how many will be accepted. If 885 applicants are accepted, is the college’s claim accurate?
______
Answer: 900 applicants will be accepted.
Explanation: As the college claims to accept 18% of its applicants of 5000 applicants, so 18% of 5000 is
0.18×5000= 900.
About 900 applicants will be accepted. If 885 applicants are accepted, the claim is accurate because 885 is close to 900.
Essential Question Check-In
Question 7.
How do you make predictions using experimental probability?
Answer: To make a prediction using experimental probability multiply the experimental probability by the number of trails to get the prediction number.
Independent Practice – Page No. 391
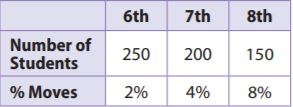
The table shows the number of students in a middle school at the beginning of the year and the percentage that can be expected to move out of the area by the end of the year.
Question 8.
How many 7th grade students are expected to move by the end of the year? If 12 students actually moved, did more or fewer 7th grade students move than expected? Justify your answer.
______ students
Answer: 8 students from 7th grade are expected to move by the end of the year.
Explanation: As 4% of 7th grades are expected to move by the end of the year, so 4% of 200 is
0.04×200= 8.
If 12 students actually moved, then more than expected would have moved.
Question 9.
Critique Reasoning
The middle school will lose some of its funding if 50 or more students move away in any year. The principal claims he only loses about 30 students a year. Do the values in the table support his claim? Explain.
______
Answer: Yes, the table supports the principal’s claim of 30 students.
Explanation: 2% of 6th graders and 8% of 8th graders are expected to move. So
2% of 250= 0.02×250
= 5.
8% of 150= 0.08×150
= 12
So in total 5+8+12= 25 students are expected to move. And the table supports the principal’s claim of 30 students.
Question 10.
Represent Real-World Problems
An airline knows that, on average, the probability that a passenger will not show up for a flight is 6%. If an airplane is fully booked and holds 300 passengers, how many seats are expected to be empty? If the airline overbooked the flight by 10 passengers, about how many passengers are expected to show up for the flight? Justify your answer.
______
Answer: The number of passengers expected to show up is then 310-19= 291 passengers.
Explanation: As 6% of the 300 seats are expected to be empty, so
6% of 300 = 0.06×300
= 18.
18 seats are expected to be empty. If the airline overbooked the flight by 10 passengers then 300+10= 310 passengers were booked, then 310×0.06= 18.6
= 19
So the number of passengers expected to show up is then 310-19= 291 passengers.
Question 11.
Draw Conclusions
In a doctor’s office, an average of 94% of the clients pay on the day of the appointment. If the office has 600 clients per month, how many are expected not to pay on the day of the appointment? If 40 clients do not pay on the day of their appointment in a month, did more or fewer than the average not pay?
______
Answer:
Explanation: 94% of the clients pay on the day of the appointment for 600 clients, so
94% of 600= 0.94 × 600
= 564
As 564 clients are expected to pay so 600- 564= 36 clients are expected not to pay on the day of the appointment. So if 40 clients do not pay, then this a little more than the average.
Page No. 392
Question 12.
Counterexamples
The soccer coach claimed that, on average, only 80% of the team come to practice each day. The table shows the number of students that came to practice for 8 days. If the team has 20 members, how many team members should come to practice to uphold the coach’s claim? Was the coach’s claim accurate? Explain your reasoning.
Answer: As all the values in the table are greater than 16 except for one value, the claim is not accurate.
Explanation: As the soccer coach claimed that only 80% of the team come to practice each day, and the team has 20 members. So
80% of 20= 0.8×20
= 16.
So 16 players in the team should come to practice to uphold the coach’s claim. As all the values in the table are greater than 16 except for one value, the claim is not accurate. More than 80% come on average to practice each day and more than 16 members on average come to practice.
Question 13.
What’s the Error?
Ronnie misses the school bus 1 out of every 30 school days. He sets up the proportion \(\frac{1}{30}\) = \(\frac{180}{x}\) to predict how many days he will miss the bus in the 180-day school year. What is Ronnie’s error?
Answer: The proportion he sets up is \(\frac{1}{30}\) = \(\frac{180}{X}\) is Ronnie’s error.
Explanation: As Ronnie misses the school bus 1 out of every 30 school days, and the proportion he sets up is \(\frac{1}{30}\) = \(\frac{180}{X}\) which is incorrect. As it should be \(\frac{1}{30}\) = \(\frac{X}{180}\) to respect the form of \(\frac{number of days missed}{total number of days}\)
H.O.T.
Focus on Higher Order Thinking
Question 14.
Persevere in Problem Solving
A gas pump machine rejects 12% of credit card transactions. If this is twice the normal rejection rate for a normal gas pump, how many out of 500 credit cards transactions would a normal gas pump machine reject?
______
Answer: The normal gas machine rejects 30 transactions.
Explanation: If 12% is twice the normal rate, then the normal rate is 6%, so 6% of 500 is
0.06×500= 30.
So the normal gas machine rejects 30 transactions.
Question 15.
Make Predictions
An airline’s weekly flight data showed a 98% probability of being on time. If this airline has 15,000 flights in a year, how many flights would you predict to arrive on time? Explain whether you can use the data to predict whether a specific flight with this airline will be on time.
______
Answer: 14,700 flights we can predict to arrive on time.
Explanation: The airline’s weekly flight data is a 98% probability of being on time, and there are 15,000 flights in a year. So 98% of 15,000 is 0.98×15000 = 14,700.
So 14,700 flights are expected to be on time and 15,000-14,700= 300 flights will not be on time. And we can use the data to predict whether a specific flight with this airline will be on time by determining the number of flights that have not been on time. If about 300 flights have not been on time then we can predict that the specific flight will be on time. If less than 300 flights have not been on time, then you can’t predict with absolute certainty if the specific flight will be on time.
Question 16.
Draw Conclusions
An average response rate for a marketing letter is 4%, meaning that 4% of the people who receive the letter respond to it. A company writes a new type of marketing letter, sends out 2,400 of them, and gets 65 responses. Explain whether the new type of letter would be considered to be a success.
Answer: As we have received fewer responses than expected and thus a new type of letter would be considered to be not successful.
Explanation: The company sends 2400 letters. And the average response rate for marketing is 4%, so we can expect only a 4% response to the 2400 letters. So
4% of 2400= \(\frac{4}{100}\) × 2400
= 4×24
= 96.
Since 96 is greater than 65, we have received fewer responses than expected and thus a new type of letter would be considered to be not successful. We should receive more responses than expected if the letter was successful.
12.1 Probability – Page No. 393
Question 1.
Josue tosses a coin and spins the spinner at the right. What are all the possible outcomes?
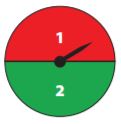
Answer: The possible outcomes are heads and 1, heads and 2, tails and 1, tails and 2.
Explanation: The spinner can land on 1 or 2 so the outcomes for the spinner 1 and 2. So the coin can land on heads or tails so the outcomes for the coin are heads and tails. The outcomes for tossing a coin and spinning the spinner are heads and 1, heads and 2, tails and 1, tails and 2.
12.2 Experimental Probability of Simple Events
Question 2.
While bowling with friends, Brandy rolls a strike in 6 out of 10 frames. What is the experimental probability that Brandy will roll a strike in the first frame of the next game?
\(\frac{□}{□}\)
Answer: The experimental probability is \(\frac{3}{5}\).
Explanation: As there are 10 frames, so possible outcomes are 10. And Brandy rolls a strike in 6, so the experimental probability that Brandy will roll a strike in the first frame of the next game is \(\frac{6}{10}\)= \(\frac{3}{5}\).
Question 3.
Ben is greeting customers at a music store. Of the first 20 people he sees enter the store, 13 are wearing jackets and 7 are not. What is the experimental probability that the next person to enter the store will be wearing a jacket?
\(\frac{□}{□}\)
Answer: The experimental probability \(\frac{13}{20}\).
Explanation: The total number of people is 20, and Ben sees 13 people were wearing jackets. So the experimental probability that the next person to enter the store will be wearing a jacket is \(\frac{13}{20}\).
12.3 Experimental Probability of Compound Events
Question 4.
Auden rolled two number cubes and recorded the results.
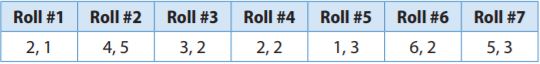
What is the experimental probability that the sum of the next two numbers rolled is greater than 5?
\(\frac{□}{□}\)
Answer: The experimental probability is latex]\frac{3}{7}[/latex].
Explanation:
The sum of two numbers for every roll is
Roll #1 is 2+1= 3.
Roll #2 is 4+5= 9.
Roll #3 is 3+2= 5.
Roll #4 is 2+2= 4.
Roll #5 is 1+3= 4
Roll #6 is 6+2= 8.
Roll #7 is 5+3= 8.
As there are 7 rolls, so the possible outcomes are 7, so the experimental probability that the sum of the next two numbers rolled is greater than 5 is \(\frac{3}{7}\).
12.4 Making Predictions with Experimental Probability
Question 5.
A player on a school baseball team reaches first base \(\frac{3}{10}\) of the time he is at bat. Out of 80 times at bat, about how many times would you predict he will reach first base?
______
Answer: We can predict that he will reach first base 24 times out 80 times at the bat.
Explanation:
We need to write a proportion:
latex]\frac{3}{10}[/latex]= latex]\frac{X}{80}[/latex].
10×X= 80×3
10×X= 240
X= 24.
So we can predict that he will reach first base 24 times out 80 times at the bat.
Essential Question
Question 6.
How is experimental probability used to make predictions?
Answer:
Selected Response – Page No. 394
Question 1.
A frozen yogurt shop offers scoops in cake cones, waffle cones, or cups. You can get vanilla, chocolate, strawberry, pistachio, or coffee flavored frozen yogurt. If you order a single scoop, how many outcomes are in the sample space?
Options:
a. 3
b. 5
c. 8
d. 15
Answer: The possible outcomes are 3×5= 15.
Explanation: As there is three option for the scoops are cake cones, waffle cones, or cups. And the five flavors are vanilla, chocolate, strawberry, pistachio, or coffee. So the possible outcomes are 3×5= 15.
Question 2.
A bag contains 7 purple beads, 4 blue beads, and 4 pink beads. What is the probability of not drawing a pink bead?
Options:
a. \(\frac{4}{15}\)
b. \(\frac{7}{15}\)
c. \(\frac{8}{15}\)
d. \(\frac{11}{15}\)
Answer: The probability of not drawing a pink bead is \(\frac{11}{15}\).
Explanation: The total number of beads in the bag are 7+4+4= 15 beads. And the pink beads are 4 beads.
The probability of not drawing a pink bead is
P(pink)+P(not pink)= 1
\(\frac{4}{15}\)+ P(not pink)= 1
P(not pink)= 1- \(\frac{4}{15}\)
= \(\frac{15-4}{15}\)
= \(\frac{11}{15}\).
Question 3.
During the month of June, Ava kept track of the number of days she saw birds in her garden. She saw birds on 18 days of the month. What is the experimental probability that she will see birds in her garden on July 1?
Options:
a. \(\frac{1}{18}\)
b. \(\frac{2}{5}\)
c. \(\frac{1}{2}\)
d. \(\frac{3}{5}\)
Answer: The experimental probability that she will see birds in her garden on July 1 is \(\frac{3}{5}\).
Explanation:
As there are 30 days in the month of June, so if Ava saw birds of those days, the experimental probability that she will see birds in her garden on July 1 is \(\frac{18}{30}\)= \(\frac{3}{5}\).
Question 4.
A rectangle has a width of 4 inches and a length of 6 inches. A similar rectangle has a width of 12 inches. What is the length of the similar rectangle?
Options:
a. 8 inches
b. 12 inches
c. 14 inches
d. 18 inches
Answer: The length is 18 inches.
Explanation: The length of the rectangle is 6 inches and the width is 4 inches and similarly width of the other rectangle is 12 inches so the length is
\(\frac{Length}{Width}\)= \(\frac{6}{4}\)= \(\frac{X}{12}\).
4×X= 12×6
4X= 72
X= 18 inches.
Question 5.
The experimental probability of hearing thunder on any given day in Ohio is 30%. Out of 600 days, on about how many days can Ohioans expect to hear thunder?
Options:
a. 90 days
b. 180 days
c. 210 days
d. 420 days
Answer: The number of days is 180 days.
Explanation: We need to find 30%. Out of 600 days
= 0.3×600
= 180 days.
The number of days is 180 days.
Question 6.
Isidro tossed two coins several times and then recorded the results in the table below.
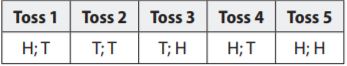
What is the experimental probability that both coins will land on the same side on Isidro’s next toss?
Options:
a. \(\frac{1}{5}\)
b. \(\frac{2}{5}\)
c. \(\frac{3}{5}\)
d. \(\frac{4}{5}\)
Answer: The experimental probability that both coins will land on the same side on Isidro’s next toss is \(\frac{2}{5}\).
Explanation: As there are 5 tosses and possible outcomes are 5. As the coin was landed twice on the same side, so the experimental probability is \(\frac{2}{5}\).
Mini-Task
Question 7.
Magdalena had a spinner that was evenly divided into sections of red, blue, and green. She spun the spinner and tossed a coin several times. The table below shows the results.
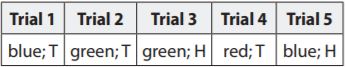
a. What are all the possible outcomes?
Answer: The possible outcomes are RH,RT,BH,BT,GH,GT.
Explanation:
The spinner can land on red, blue, and green and the coin can land heads or tails so the possible outcomes are red and heads, red and tails, blue and heads, blue and tails, green and heads and green and tails.
Question 7.
b. What experimental probability did Magdalena find for spinning blue? Give your answer as a fraction in simplest form, as a decimal, and as a percent.
Answer: The experimental probability is 40%.
Explanation: The total trails are 5 and Magdalena spun blue twice,
so the experimental probability is 2/5 = 0.4
= 40%
Question 7.
c. Out of 90 trials, how many times should Magdalena predict she will spin green while tossing tails?
______ times
Answer: We can predict that she will spin green 36 times.
Explanation: The total trails are 5 and Magdalena spun green twice,
so the experimental probability is 2/5.
And out of 90 trails, we can predict that she will spin green
2/5×90
= 18×2
= 36 times.
Conclusion:
We believe the information provided in this article is helpful for you. Refer Go Math Answer Key Grade 7 Chapter 12 Experimental Probability and enhance your math skills. You can also test your skills by solving the questions which are provided at the end of the chapter. All the Best!!!