Engage NY Eureka Math 8th Grade Module 5 Lesson 2 Answer Key
Eureka Math Grade 8 Module 5 Lesson 2 Example Answer Key
Exercises 1–5
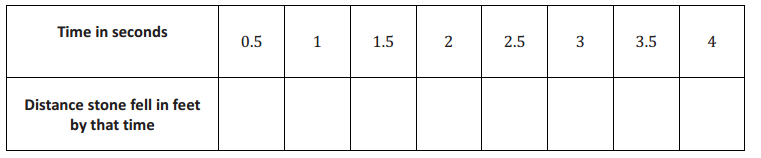
Exercise 1.
Let D be the distance traveled in time t. Use the equation D = 16t2 to calculate the distance the stone dropped for the given time t.
Answer:
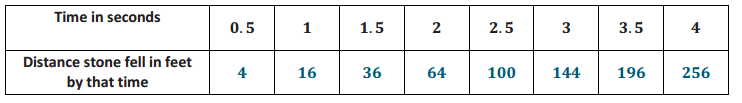
a. Are the distances you calculated equal to the table from Lesson 1?
Answer:
Yes
b. Does the function D = 16t2 accurately represent the distance the stone fell after a given time t? In other words, does the function described by this rule assign to t the correct distance? Explain.
Answer:
Yes, the function accurately represents the distance the stone fell after the given time interval. Each computation using the function resulted in the correct distance. Therefore, the function assigns to t the correct distance.
Exercise 2.
Can the table shown below represent values of a function? Explain.
Answer:
No, the table cannot represent a function because the input of 5 has two different outputs. Functions assign only one output to each input.
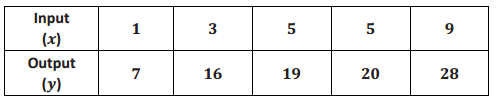
Exercise 3.
Can the table shown below represent values of a function? Explain.
Answer:
No, the table cannot represent a function because the input of 7 has two different outputs. Functions assign only one output to each input.
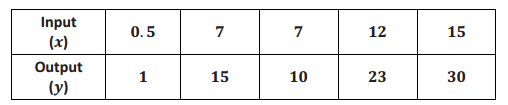
Exercise 4.
Can the table shown below represent values of a function? Explain.
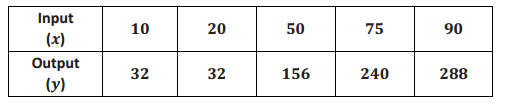
Answer:
Yes, the table can represent a function. Even though there are two outputs that are the same, each input has only one output.
Exercise 5.
It takes Josephine 34 minutes to complete her homework assignment of 10 problems. If we assume that she works at a constant rate, we can describe the situation using a function.
a. Predict how many problems Josephine can complete in 25 minutes.
Answer:
Answers will vary.
b. Write the two-variable linear equation that represents Josephine’s constant rate of work.
Answer:
Let y be the number of problems she can complete in x minutes.
\(\frac{10}{34}\) = \(\frac{y}{x}\)
y = \(\frac{10}{34}\) x
y = \(\frac{5}{17}\) x
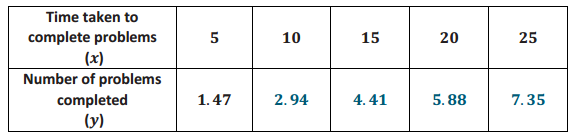
c. Use the equation you wrote in part (b) as the formula for the function to complete the table below. Round your answers to the hundredths place.
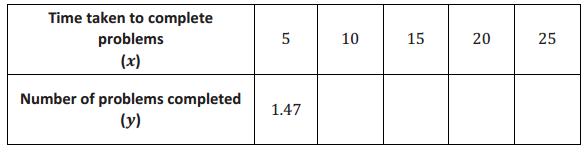
After 5 minutes, Josephine was able to complete 1.47 problems, which means that she was able to complete 1 problem, then get about halfway through the next problem.
Answer:
d. Compare your prediction from part (a) to the number you found in the table above.
Answer:
Answers will vary.
e. Use the formula from part (b) to compute the number of problems completed when x = -7. Does your answer make sense? Explain.
Answer:
y = \(\frac{5}{17}\) (-7)
= -2.06
No, the answer does not make sense in terms of the situation. The answer means that Josephine can complete -2.06 problems in -7 minutes. This obviously does not make sense.
f. For this problem, we assumed that Josephine worked at a constant rate. Do you think that is a reasonable assumption for this situation? Explain.
Answer:
It does not seem reasonable to assume constant rate for this situation. Just because Josephine was able to complete 10 problems in 34 minutes does not necessarily mean she spent the exact same amount of time on each problem. For example, it may have taken her 20 minutes to do 1 problem and then 14 minutes total to finish the remaining 9 problems.
Eureka Math Grade 8 Module 5 Lesson 2 Problem Set Answer Key
Question 1.
The table below represents the number of minutes Francisco spends at the gym each day for a week. Does the data shown below represent values of a function? Explain.
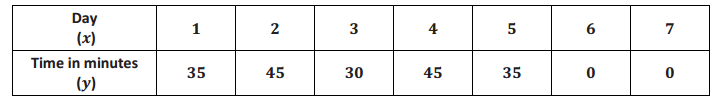
Answer:
Yes, the table can represent a function because each input has a unique output. For example, on day 1, Francisco was at the gym for 35 minutes.
Question 2.
Can the table shown below represent values of a function? Explain.
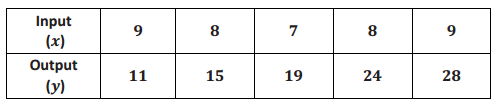
Answer:
No, the table cannot represent a function because the input of 9 has two different outputs, and so does the input of 8. Functions assign only one output to each input.
Question 3.
Olivia examined the table of values shown below and stated that a possible rule to describe this function could be y = -2x + 9. Is she correct? Explain.
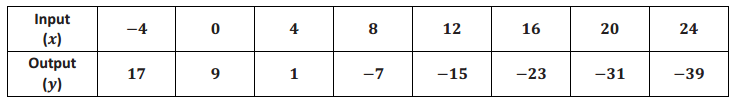
Answer:
Yes, Olivia is correct. When the rule is used with each input, the value of the output is exactly what is shown in the table. Therefore, the rule for this function could well be y = -2x + 9.
Question 4.
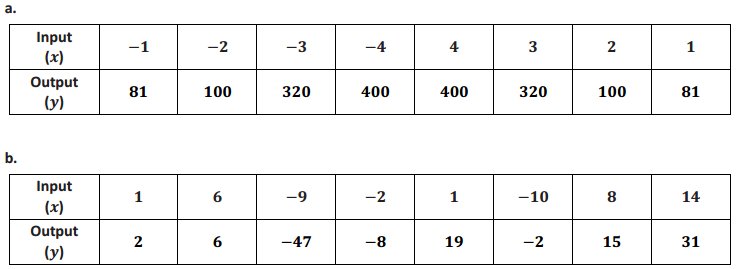
Peter said that the set of data in part (a) describes a function, but the set of data in part (b) does not. Do you agree? Explain why or why not.
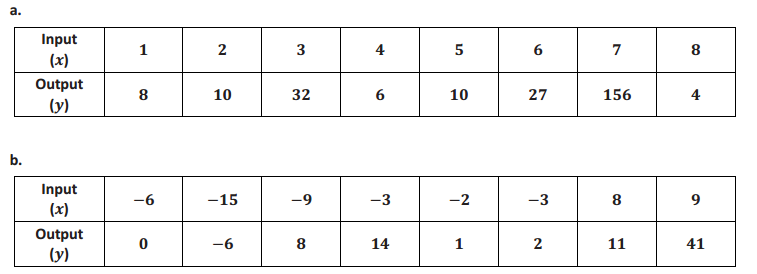
Answer:
Peter is correct. The table in part (a) fits the definition of a function. That is, there is exactly one output for each input. The table in part (b) cannot be a function. The input -3 has two outputs, 14 and 2. This contradicts the definition of a function; therefore, it is not a function.
Question 5.
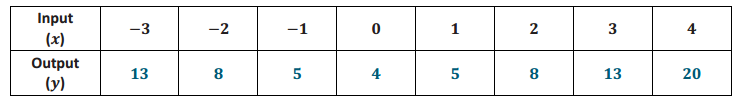
A function can be described by the rule y = x2 + 4. Determine the corresponding output for each given input.
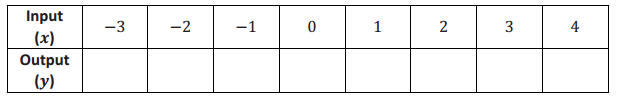
Answer:
Question 6.
Examine the data in the table below. The inputs and outputs represent a situation where constant rate can be assumed. Determine the rule that describes the function.
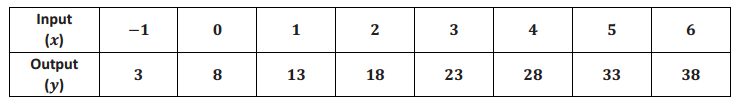
Answer:
The rule that describes this function is y = 5x + 8.
Question 7.
Examine the data in the table below. The inputs represent the number of bags of candy purchased, and the outputs represent the cost. Determine the cost of one bag of candy, assuming the price per bag is the same no matter how much candy is purchased. Then, complete the table.
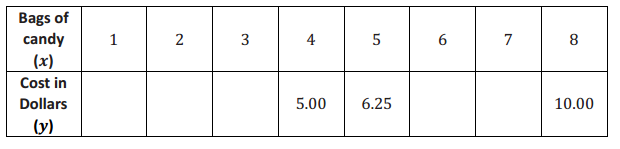
Answer:
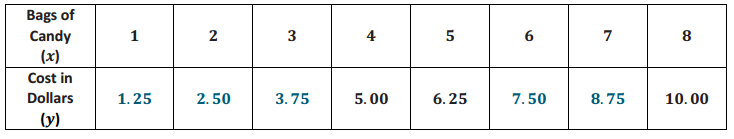
a. Write the rule that describes the function.
Answer:
y = 1.25x
b. Can you determine the value of the output for an input of x = -4? If so, what is it?
Answer:
When x = -4, the output is -5.
c. Does an input of -4 make sense in this situation? Explain.
Answer:
No, an input of -4 does not make sense for the situation. It would mean -4 bags of candy. You cannot purchase -4 bags of candy.
Question 8.
Each and every day a local grocery store sells 2 pounds of bananas for $1.00. Can the cost of 2 pounds of bananas be represented as a function of the day of the week? Explain.
Answer:
Yes, this situation can be represented by a function. Assign to each day of the week the value $1.00.
Question 9.
Write a brief explanation to a classmate who was absent today about why the table in part (a) is a function and the table in part (b) is not.
Answer:
The table in part (a) is a function because each input has exactly one output. This is different from the information in the table in part (b). Notice that the input of 1 has been assigned two different values. The input of 1 is assigned 2 and 19. Because the input of 1 has more than one output, this table cannot represent a function.
Eureka Math Grade 8 Module 5 Lesson 2 Exit Ticket Answer Key
Question 1.
Can the table shown below represent values of a function? Explain.
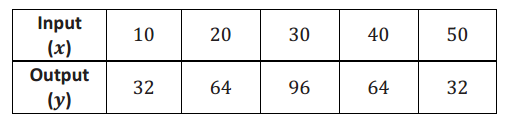
Answer:
Yes, the table can represent a function. Each input has exactly one output.
Question 2.
Kelly can tune 4 cars in 3 hours. If we assume he works at a constant rate, we can describe the situation using a function.
a. Write the function that represents Kelly’s constant rate of work.
Answer:
Let y represent the number of cars Kelly can tune up in x hours; then
\(\frac{y}{x}\) = \(\frac{4}{3}\)
y = \(\frac{4}{3}\) x
b. Use the function you wrote in part (a) as the formula for the function to complete the table below. Round your answers to the hundredths place.
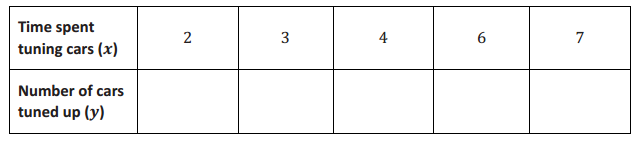
Answer:
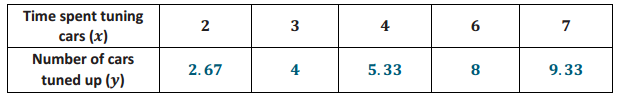
c. Kelly works 8 hours per day. According to this work, how many cars will he finish tuning at the end of a shift?
Answer:
Using the function, Kelly will tune up 10.67 cars at the end of his shift. That means he will finish tuning up 10 cars and begin tuning up the 11th car.
d. For this problem, we assumed that Kelly worked at a constant rate. Do you think that is a reasonable assumption for this situation? Explain.
Answer:
No, it does not seem reasonable to assume a constant rate for this situation. Just because Kelly tuned up 4 cars in 3 hours does not mean he spent the exact same amount of time on each car. One car could have taken 1 hour, while the other three could have taken 2 hours total.